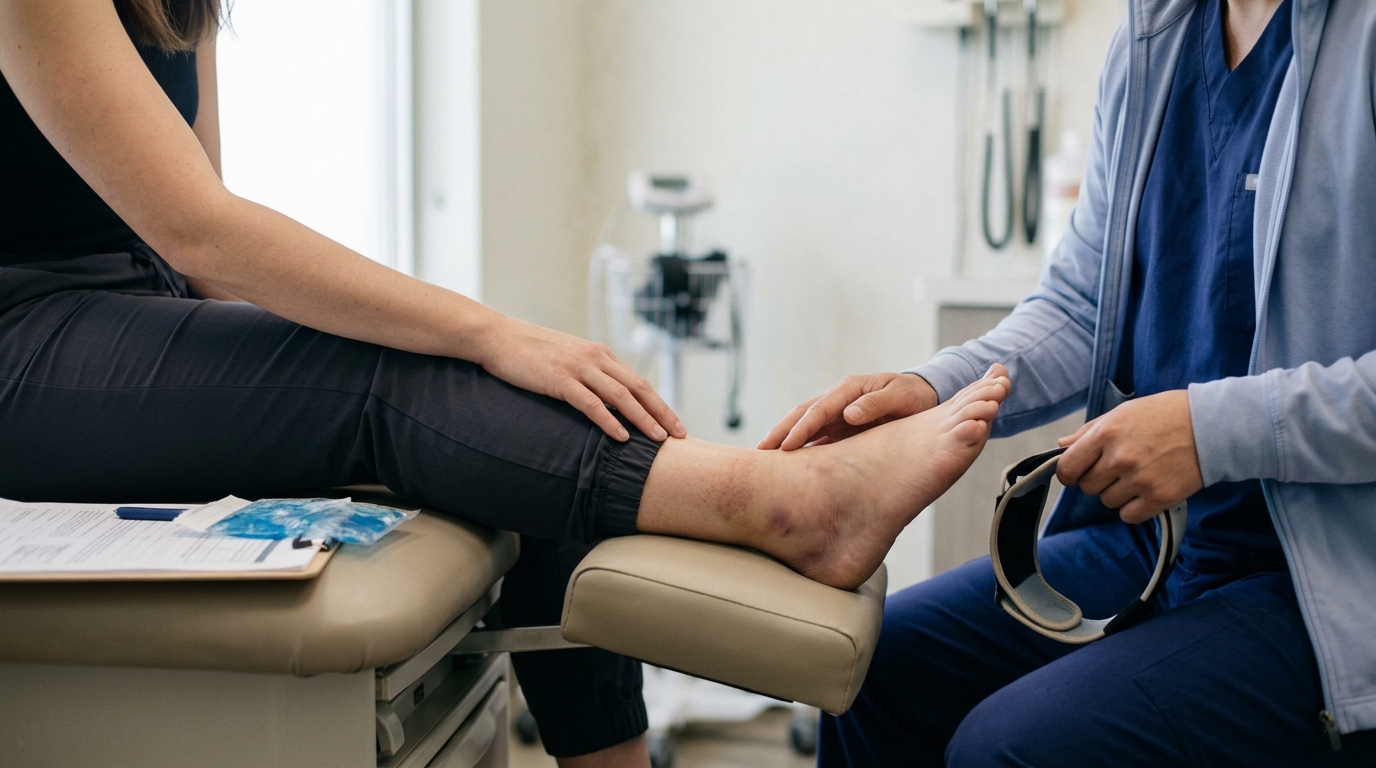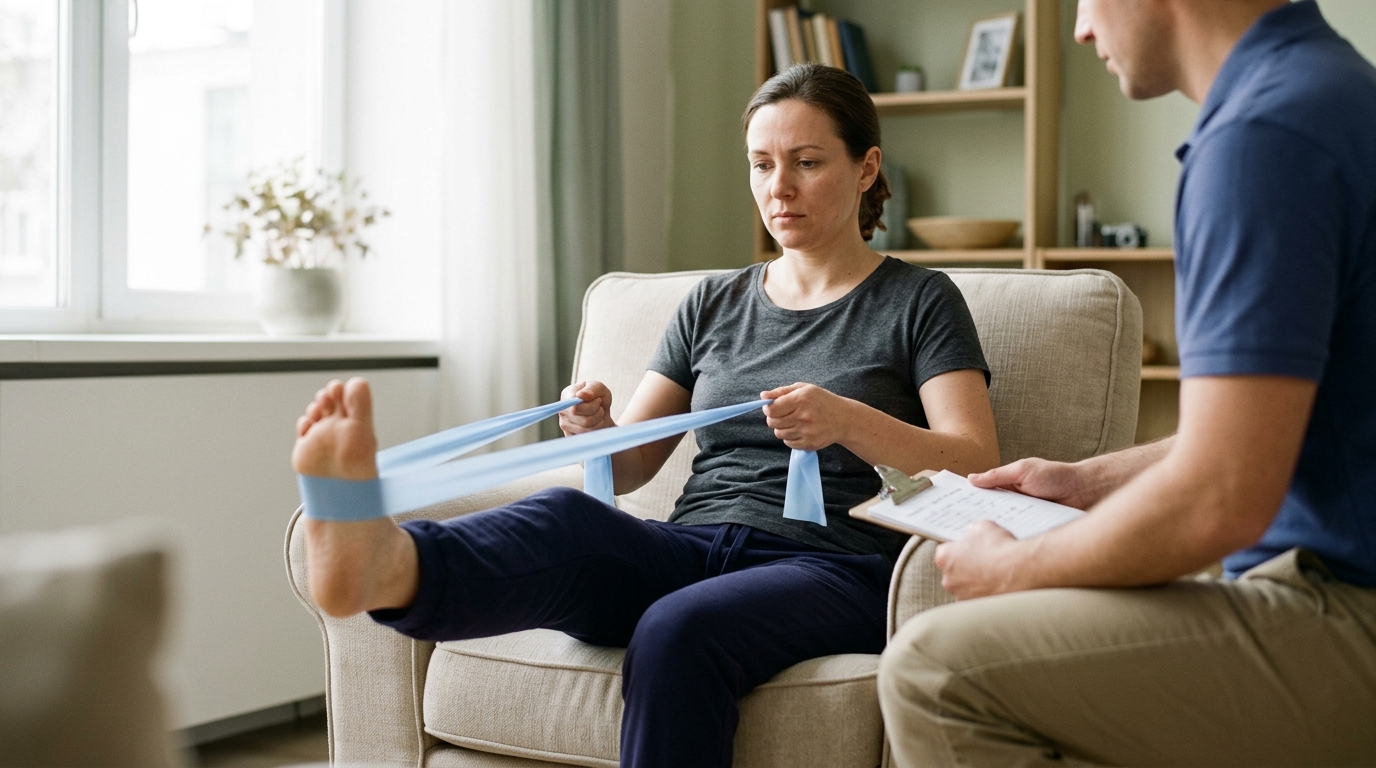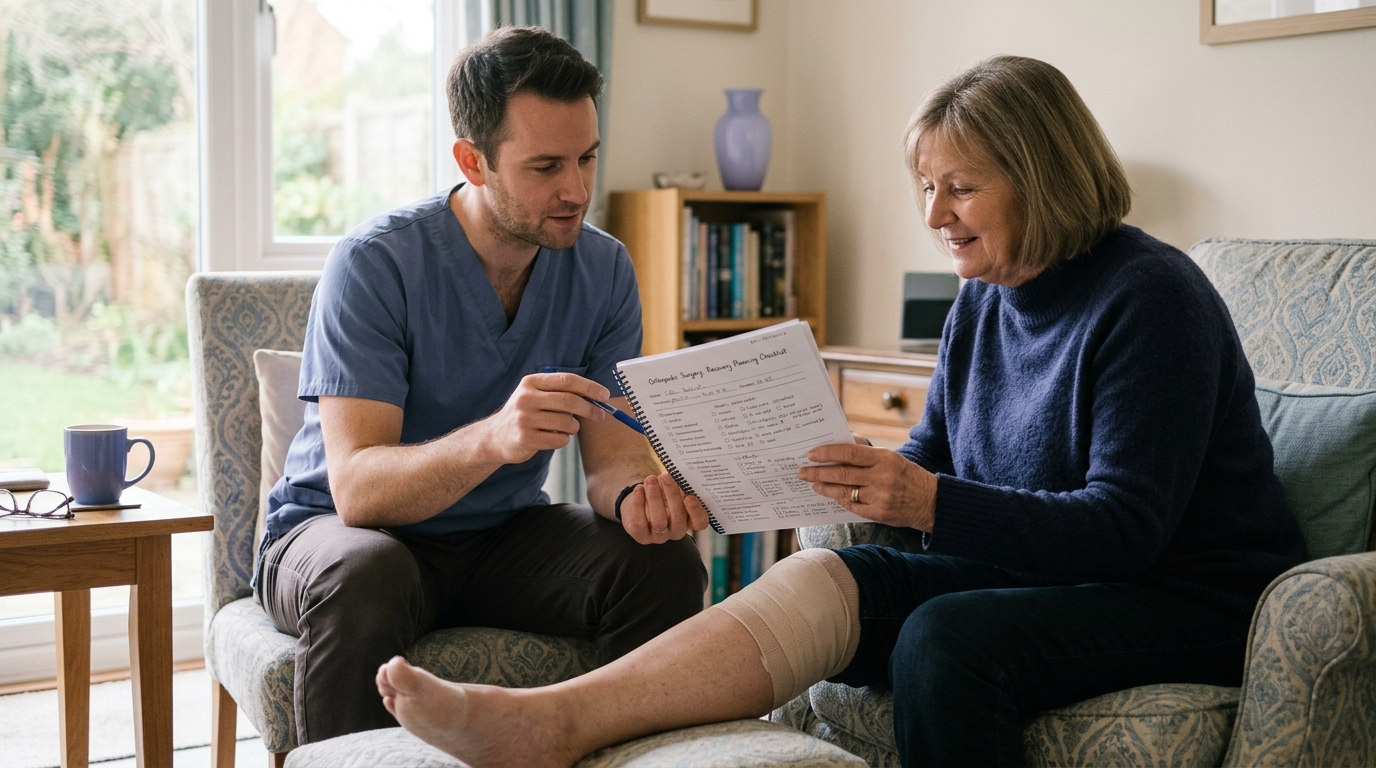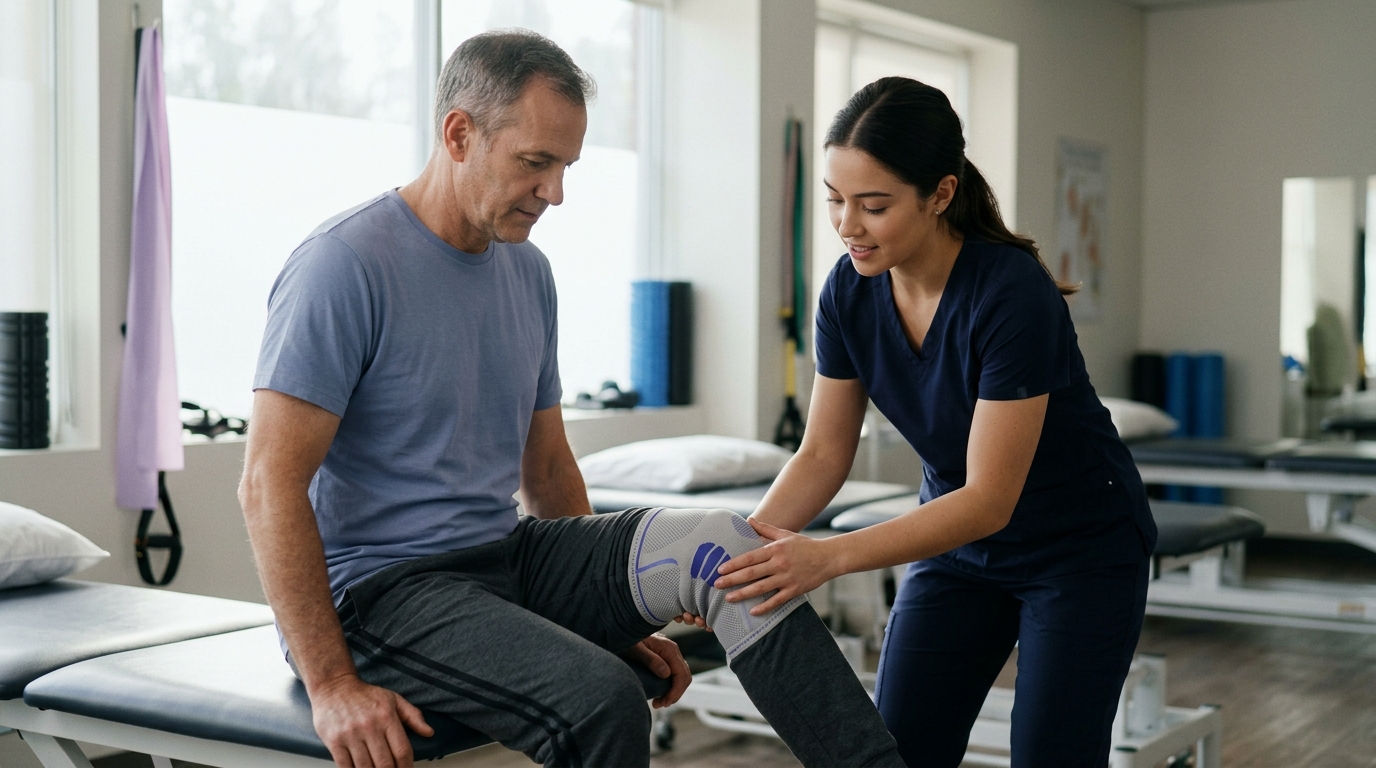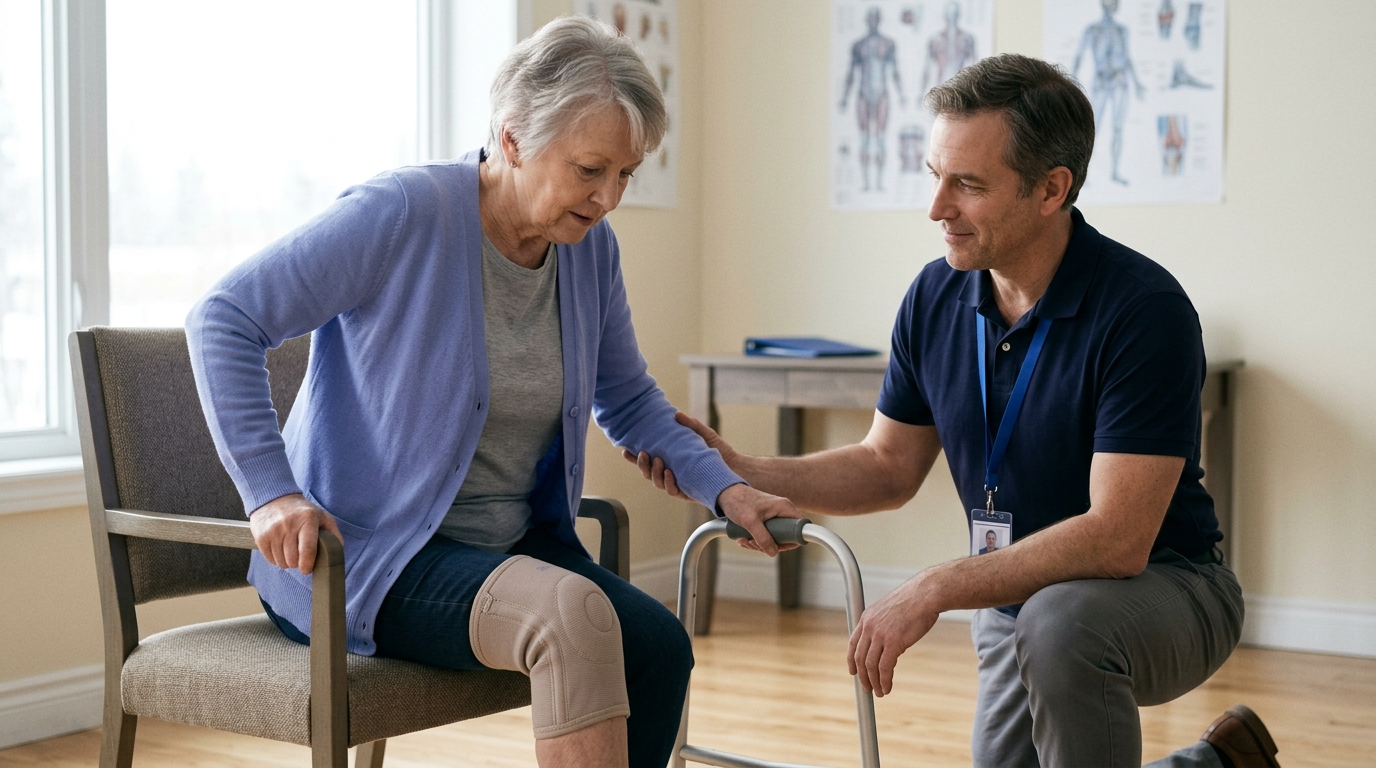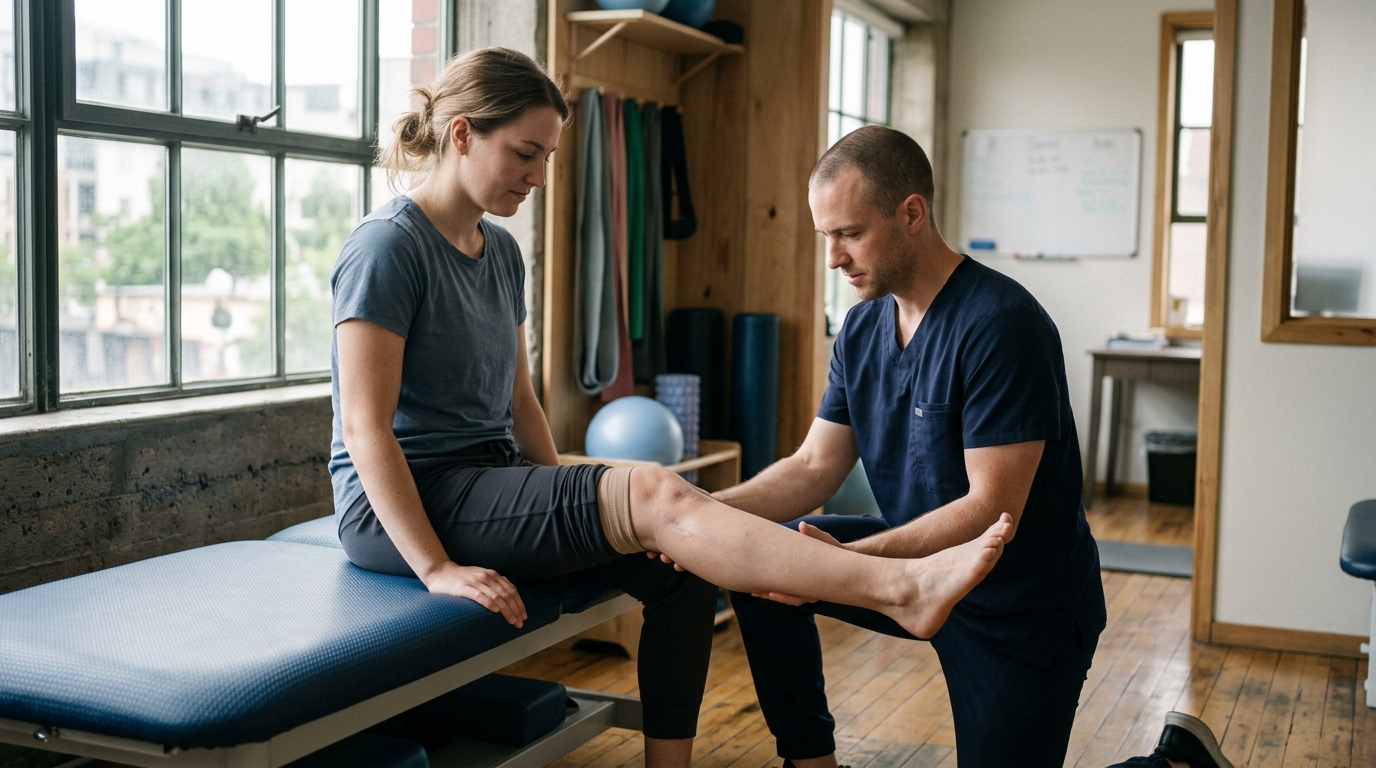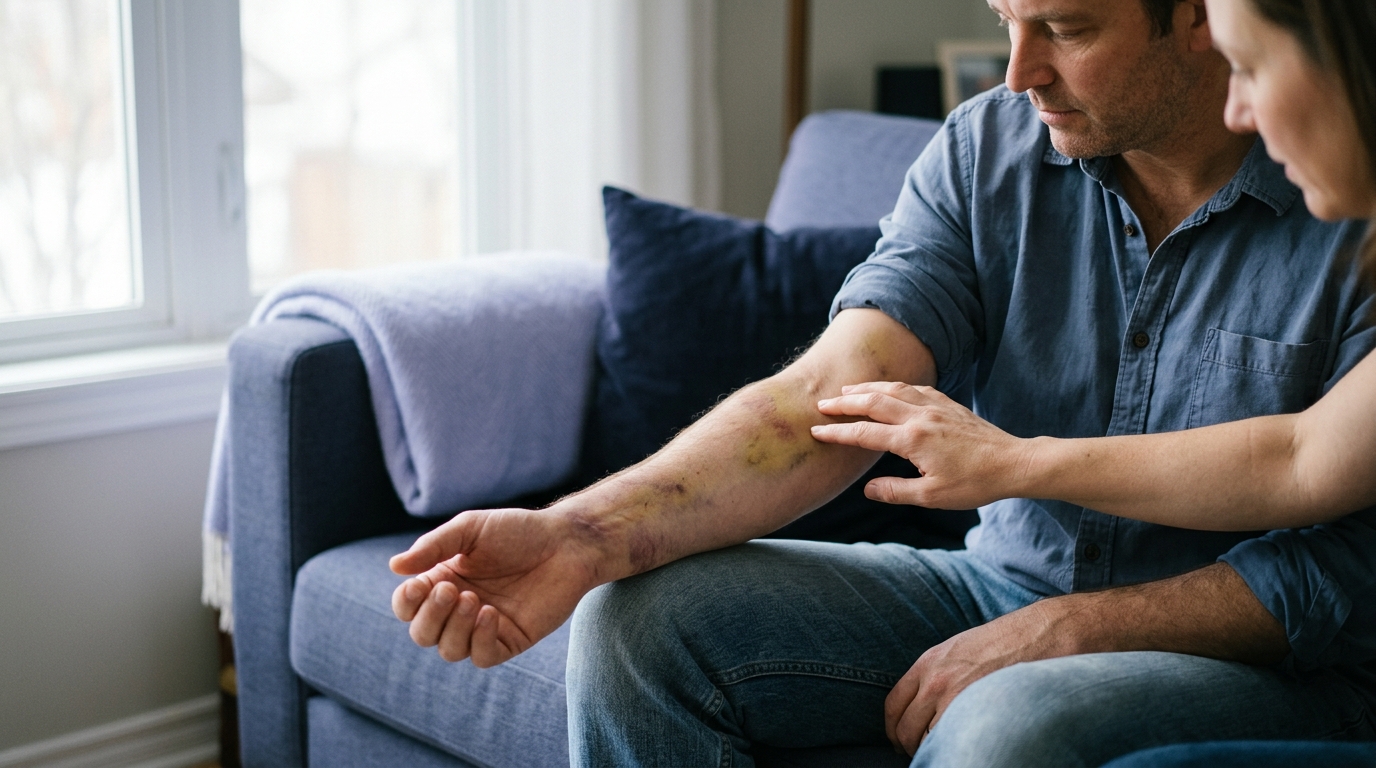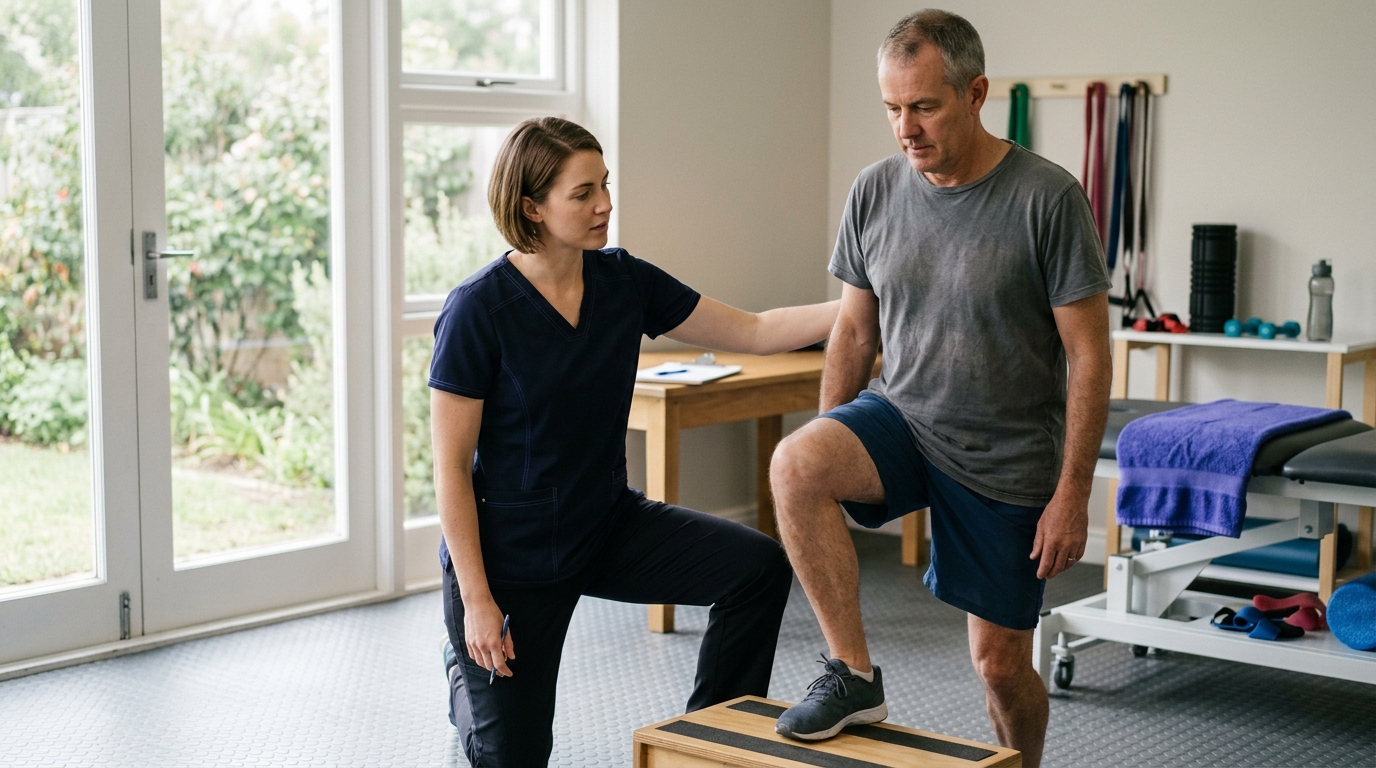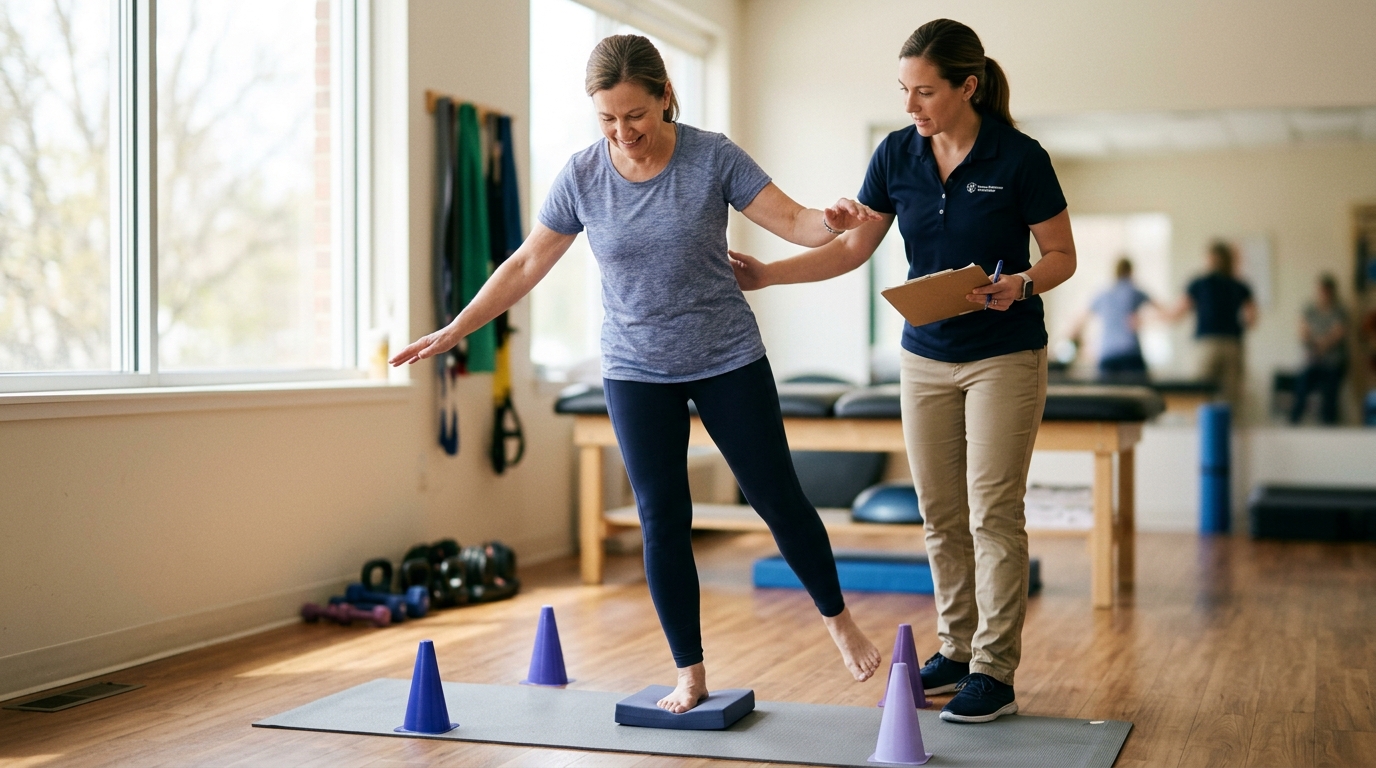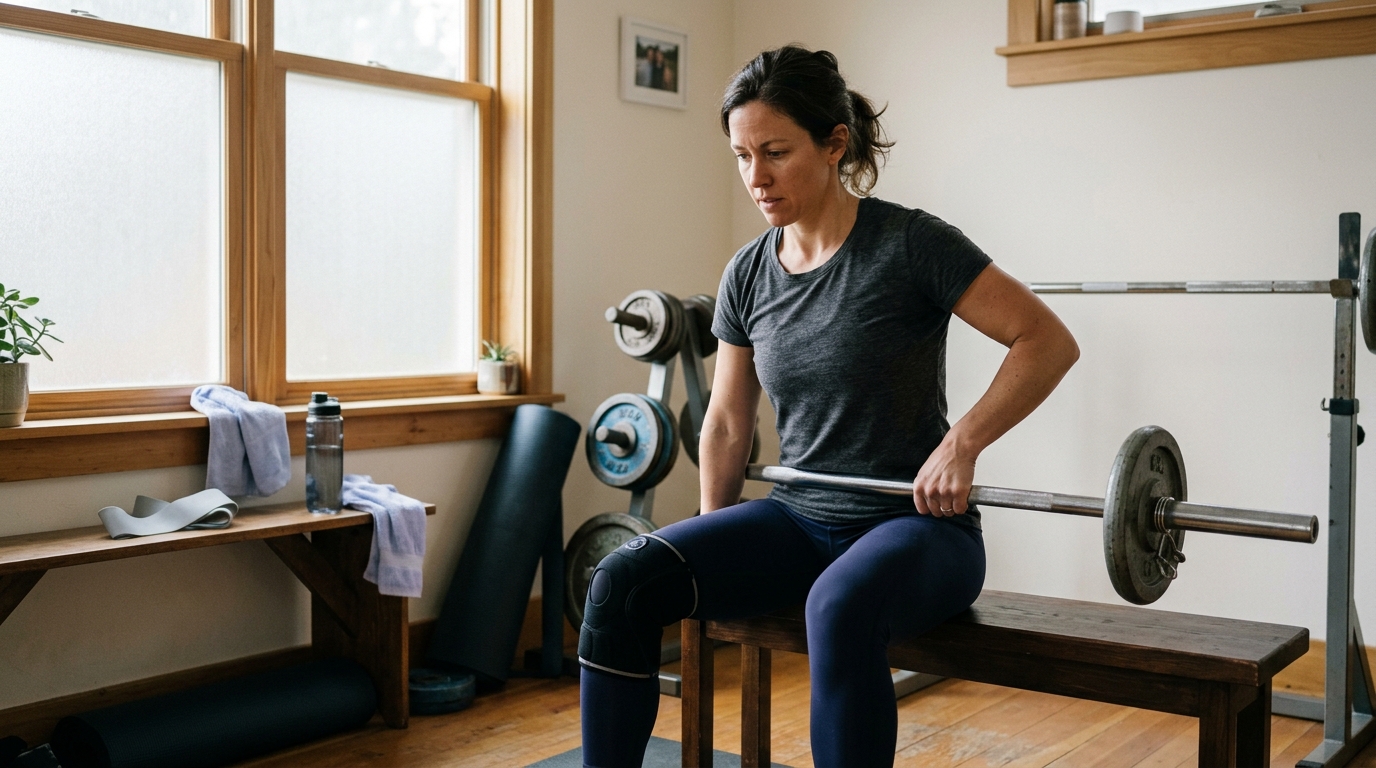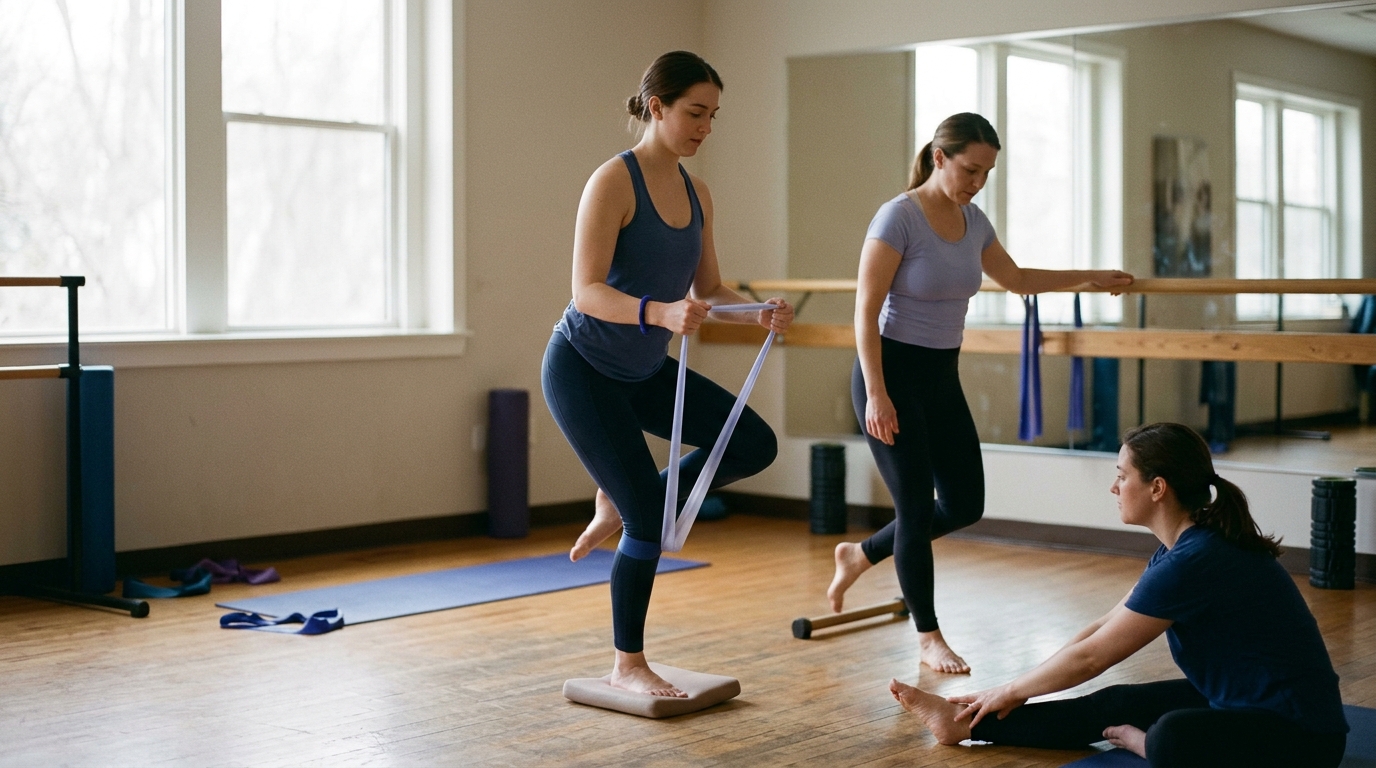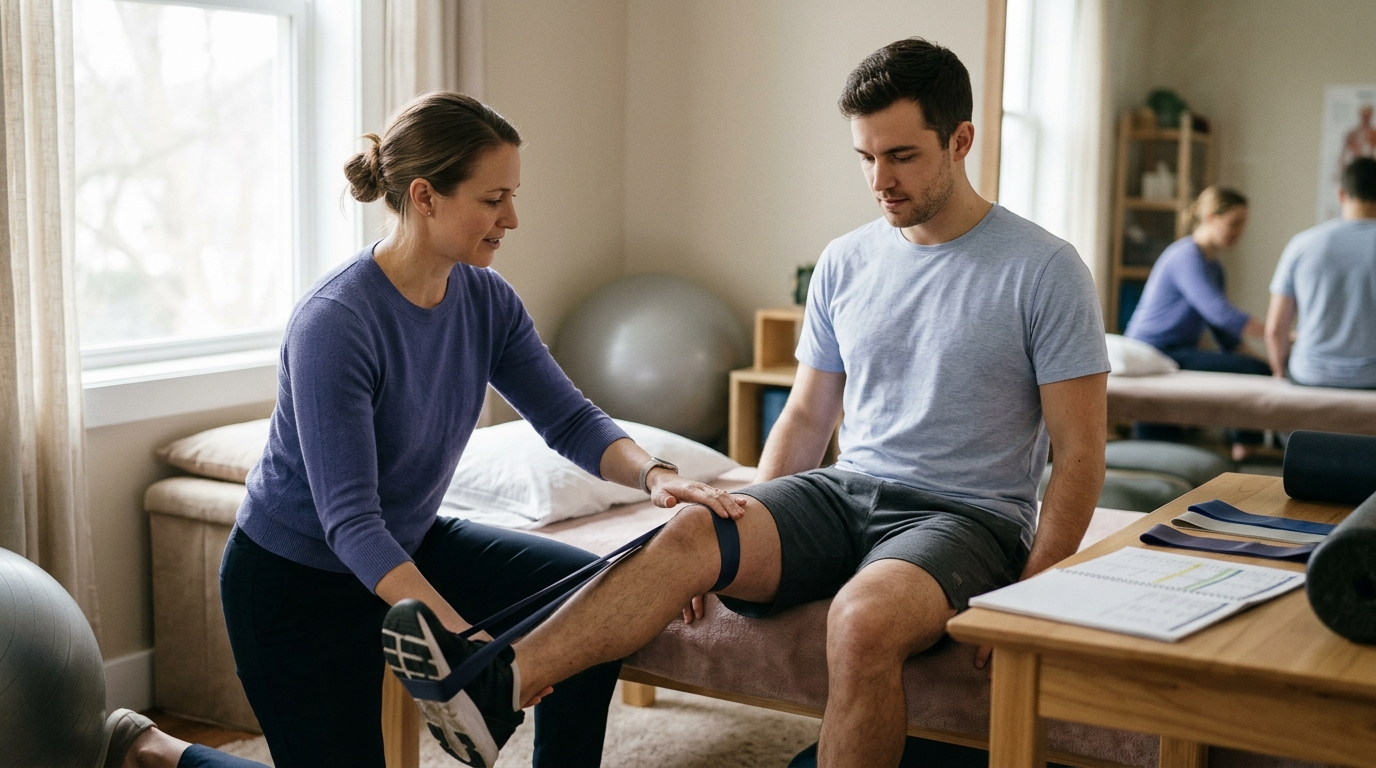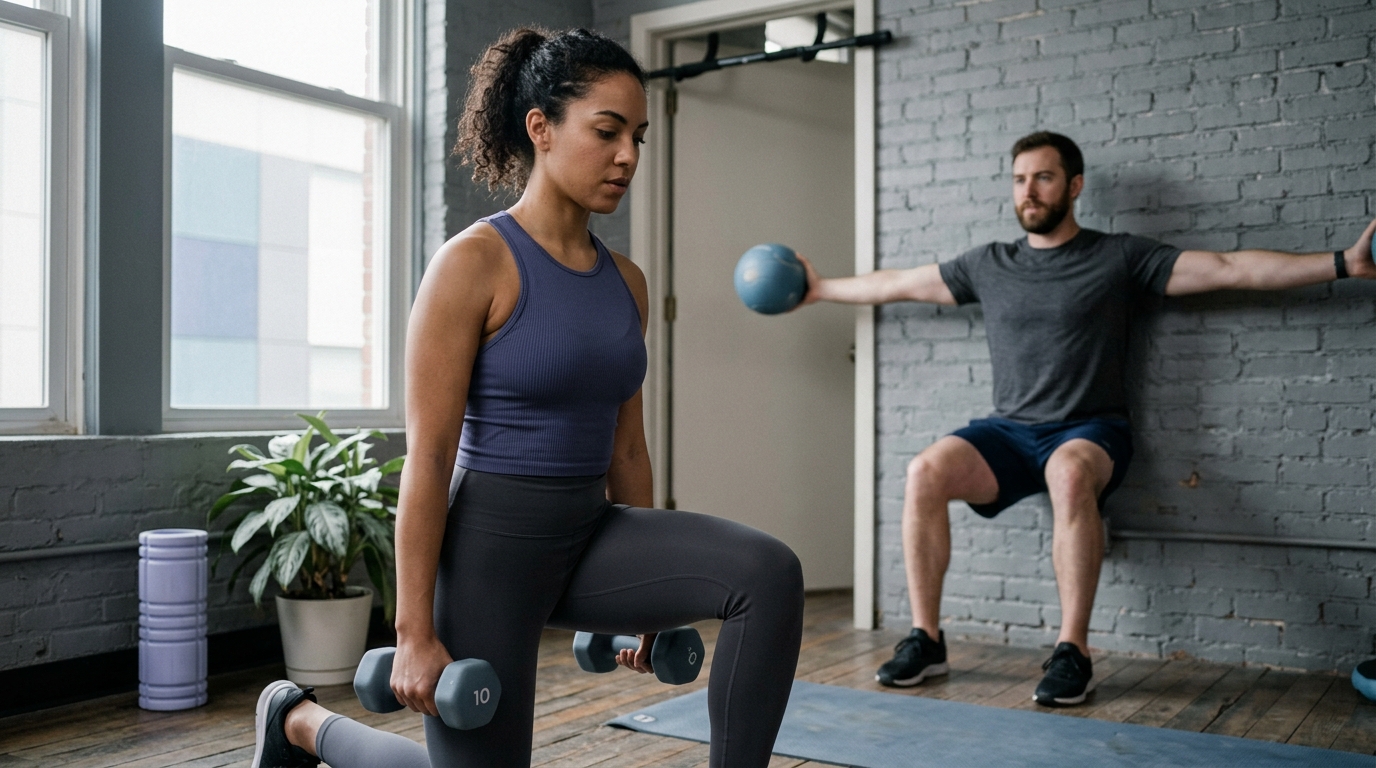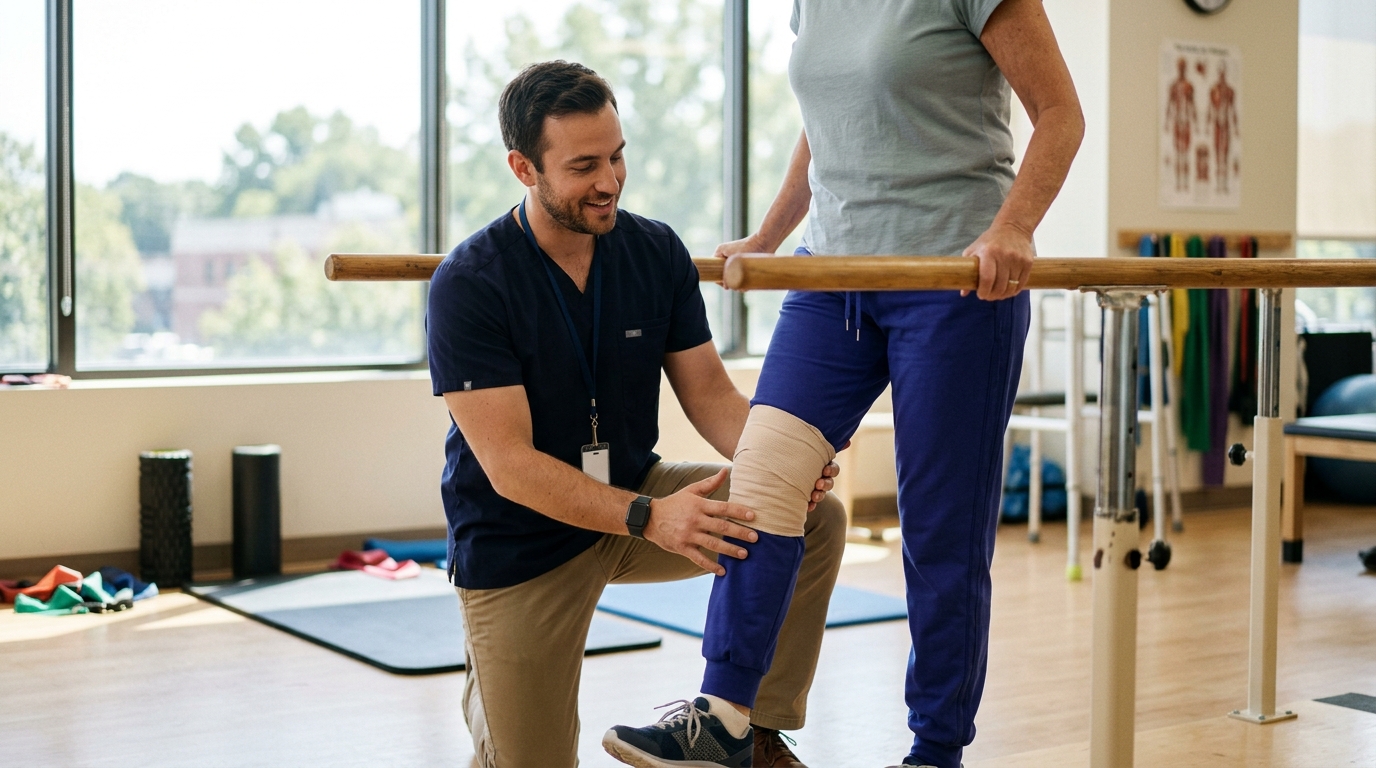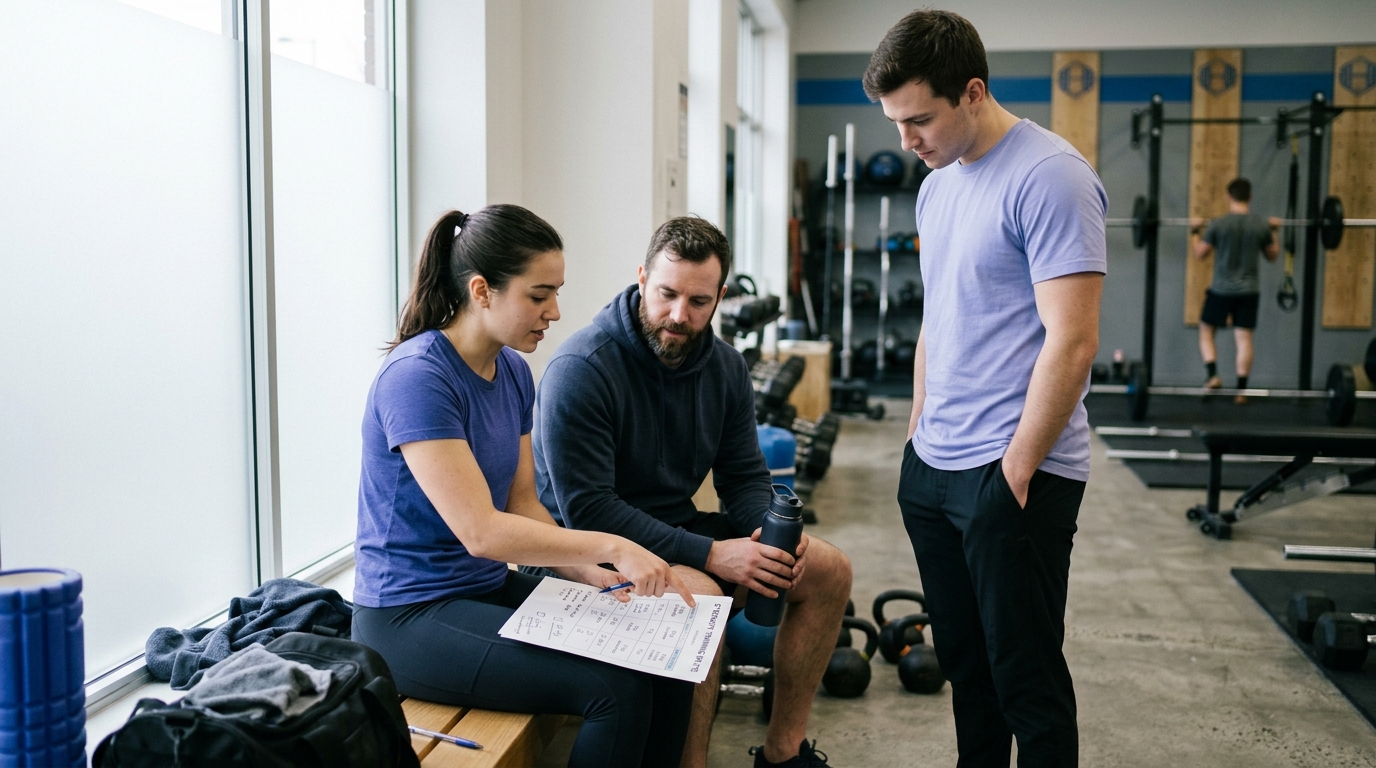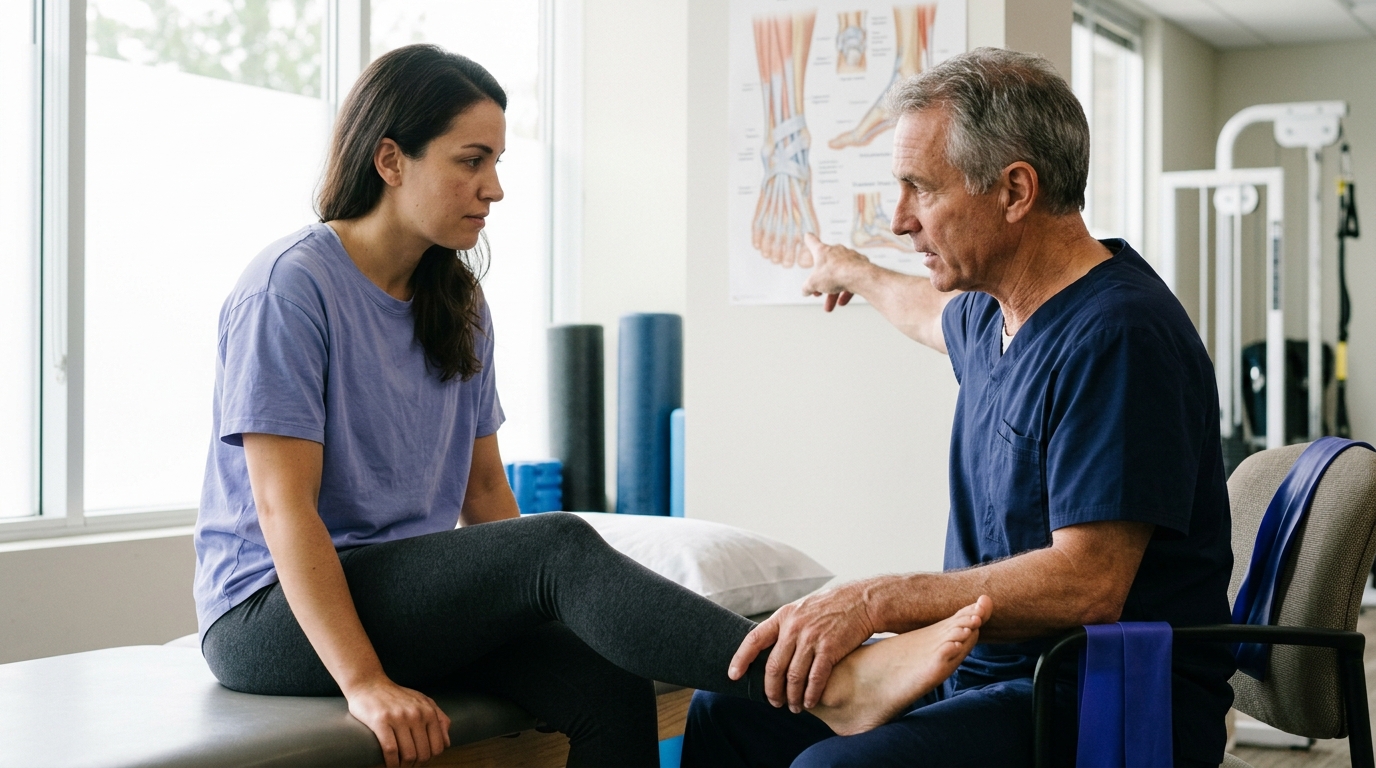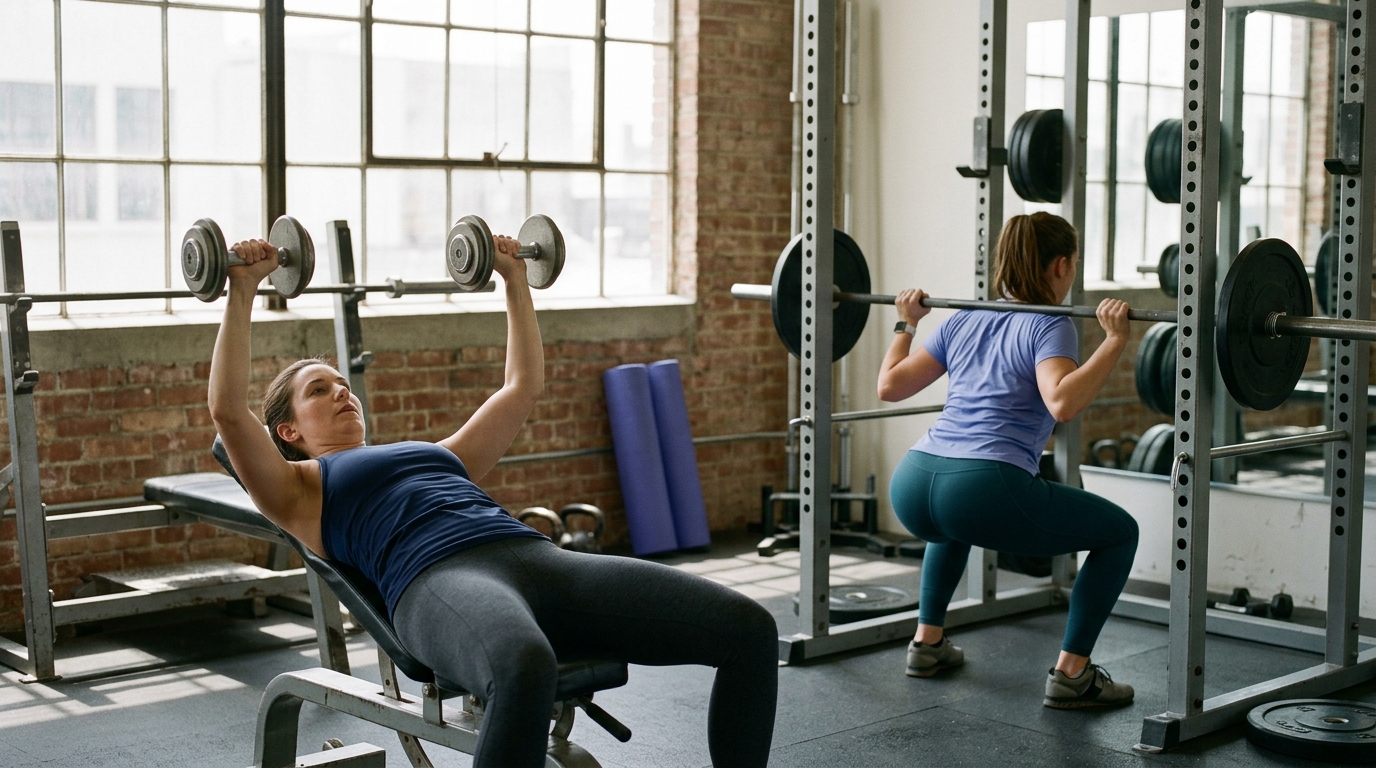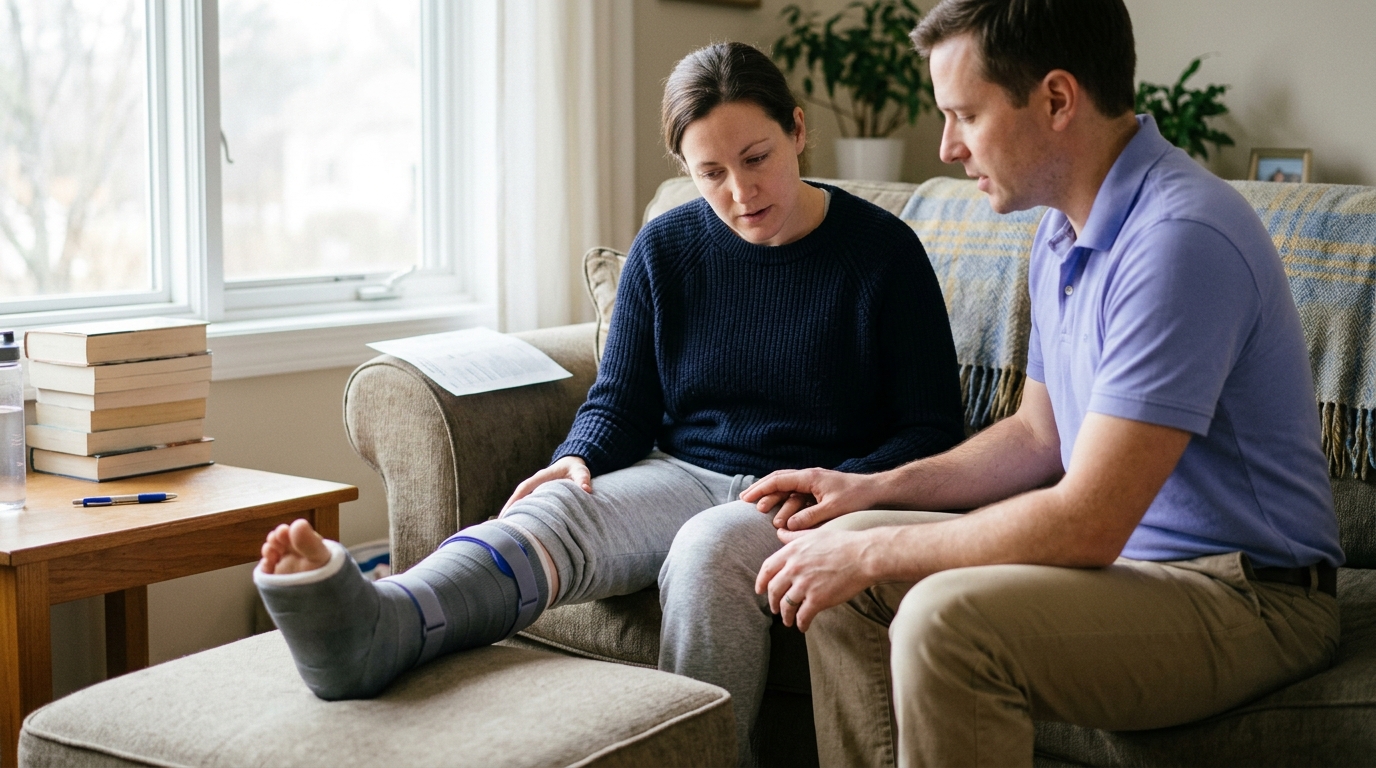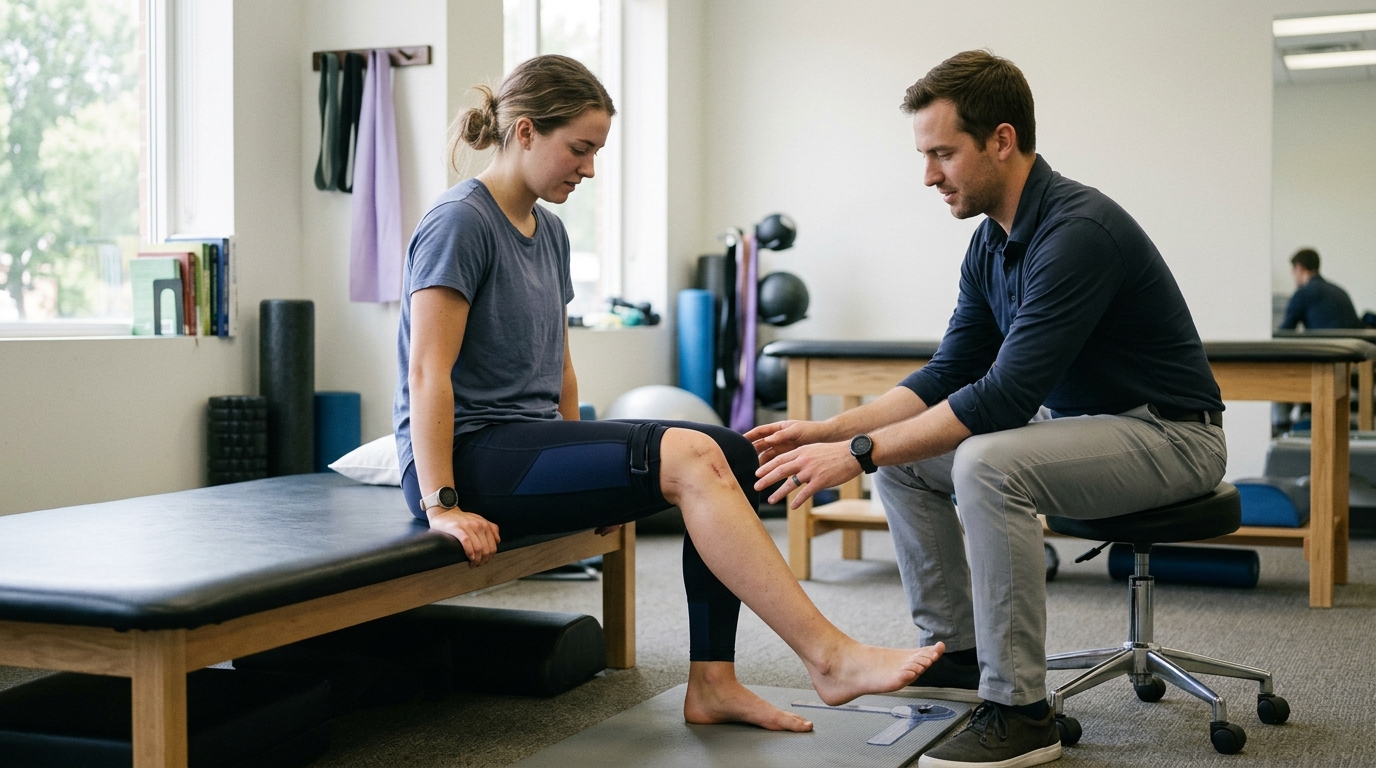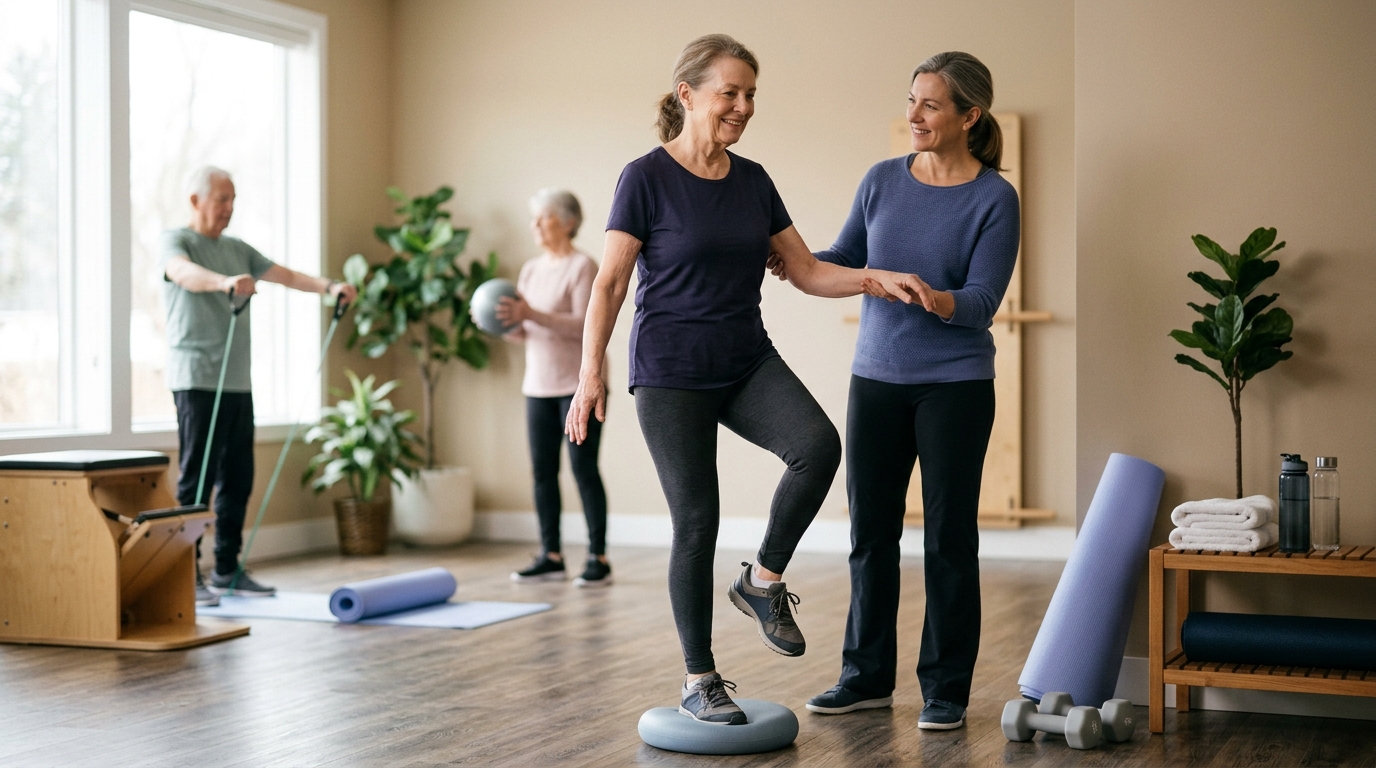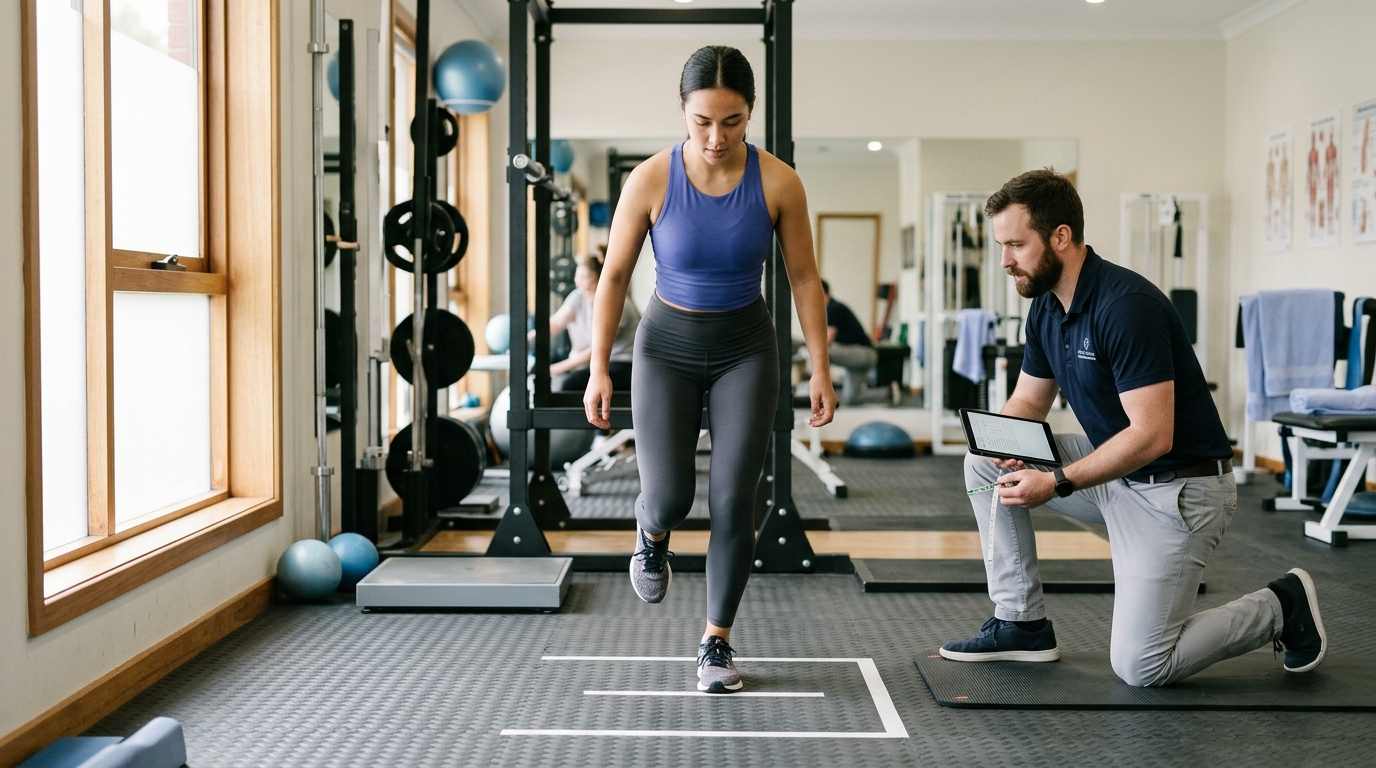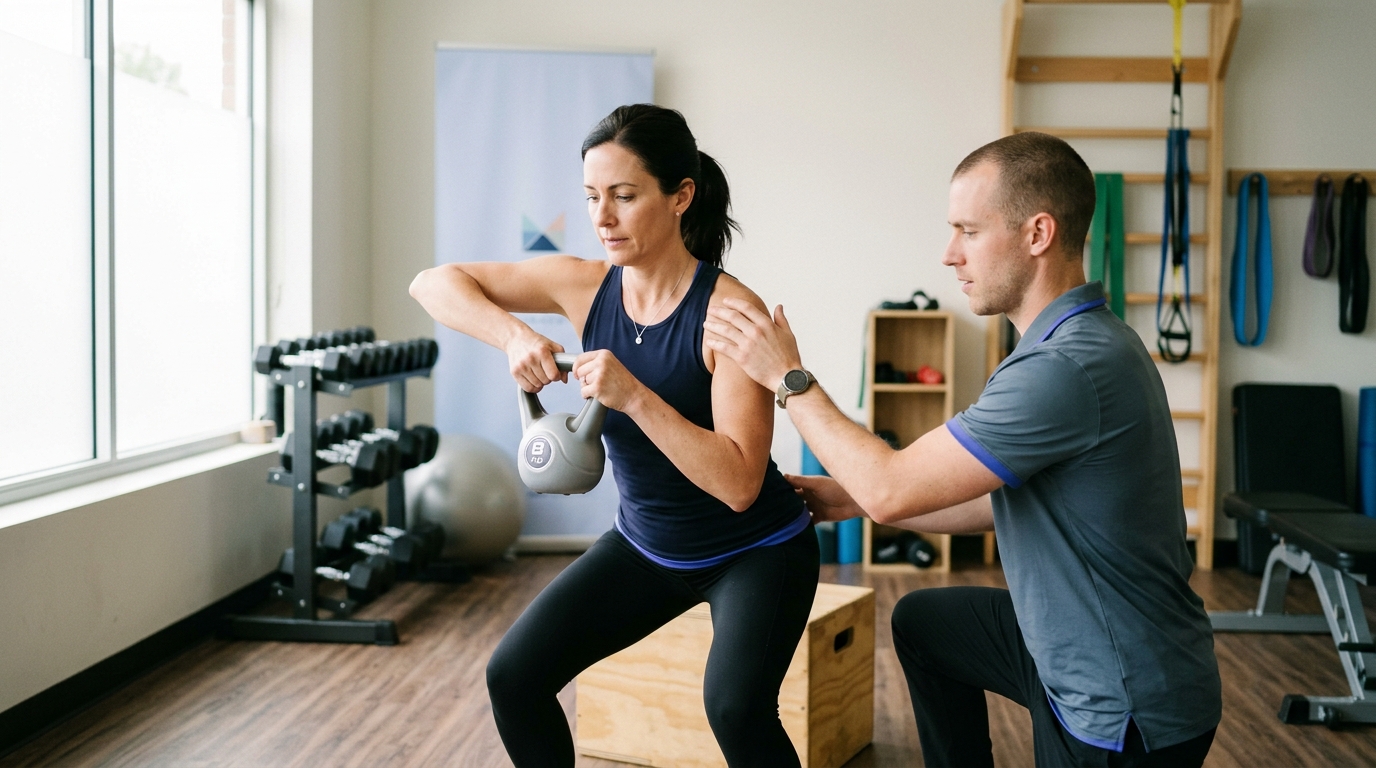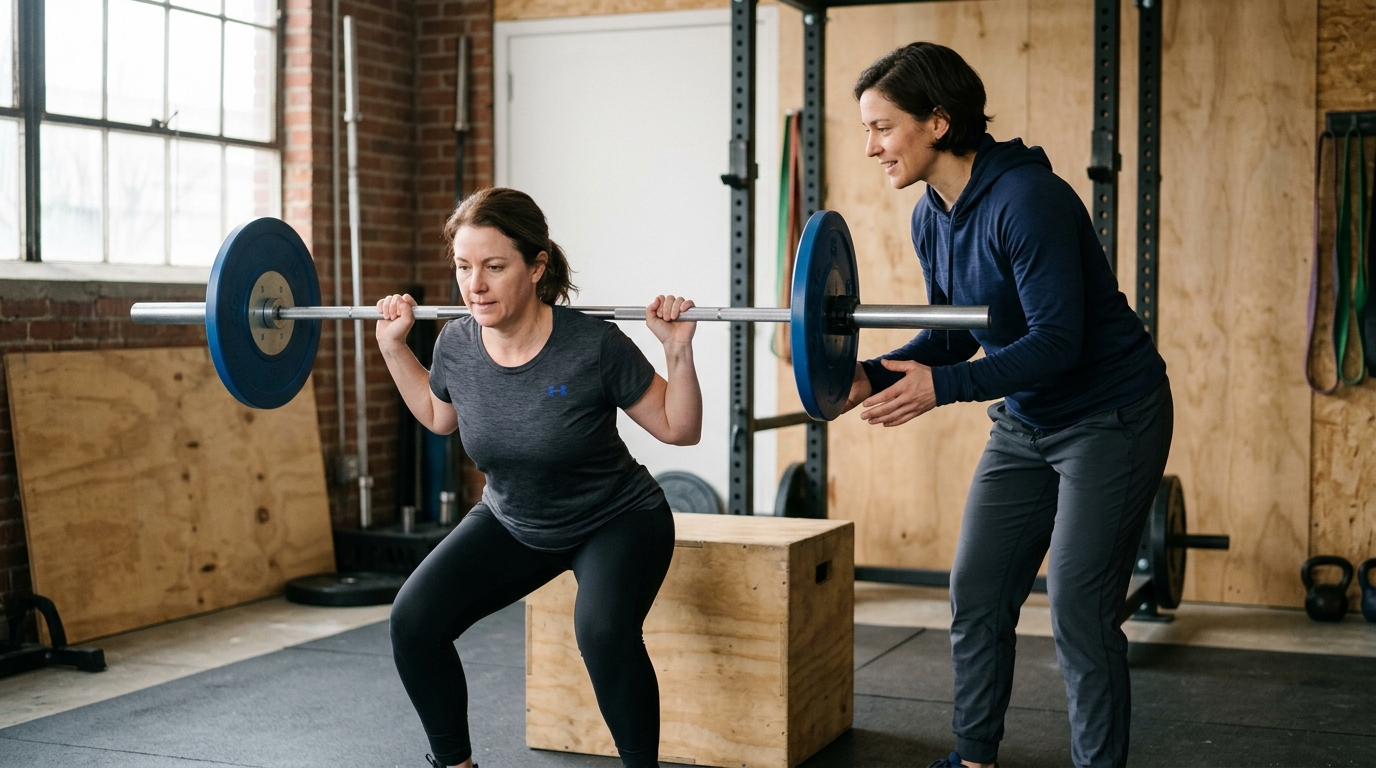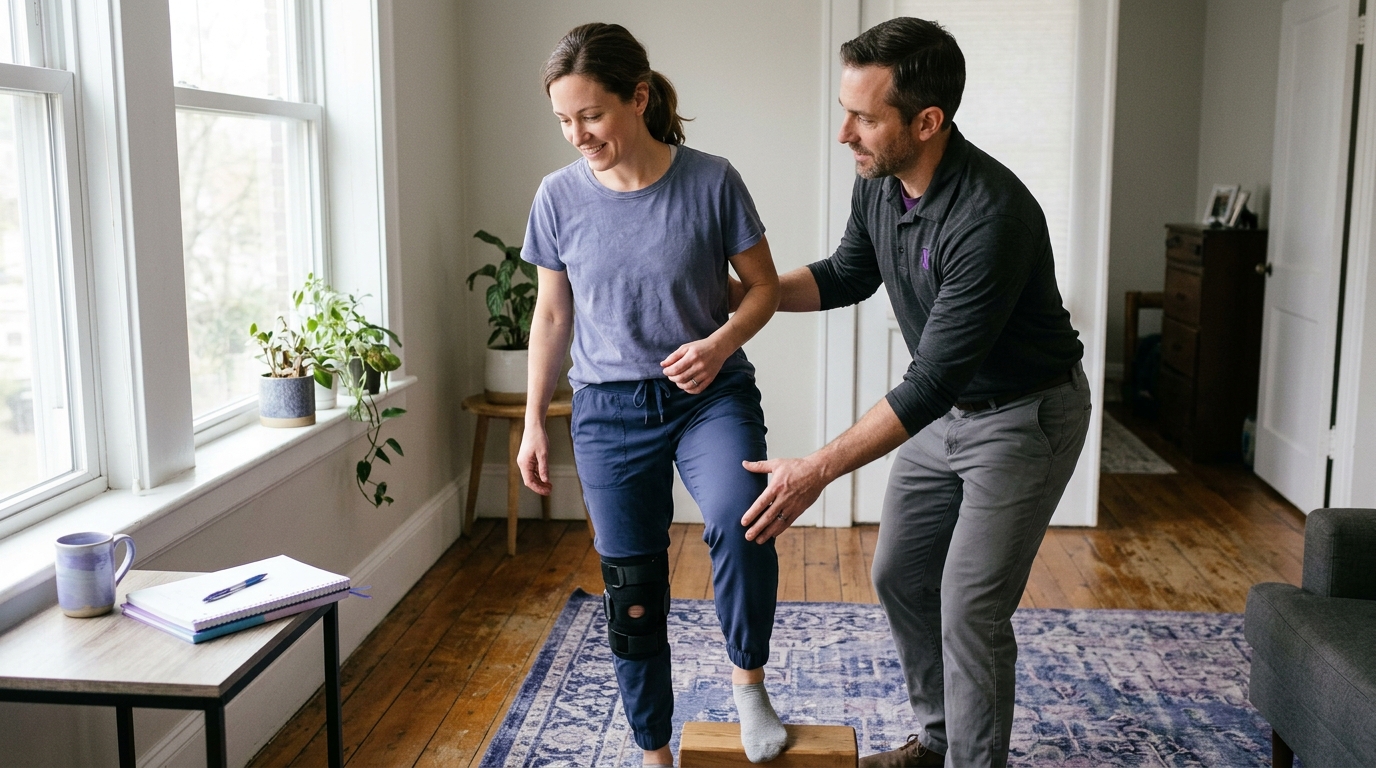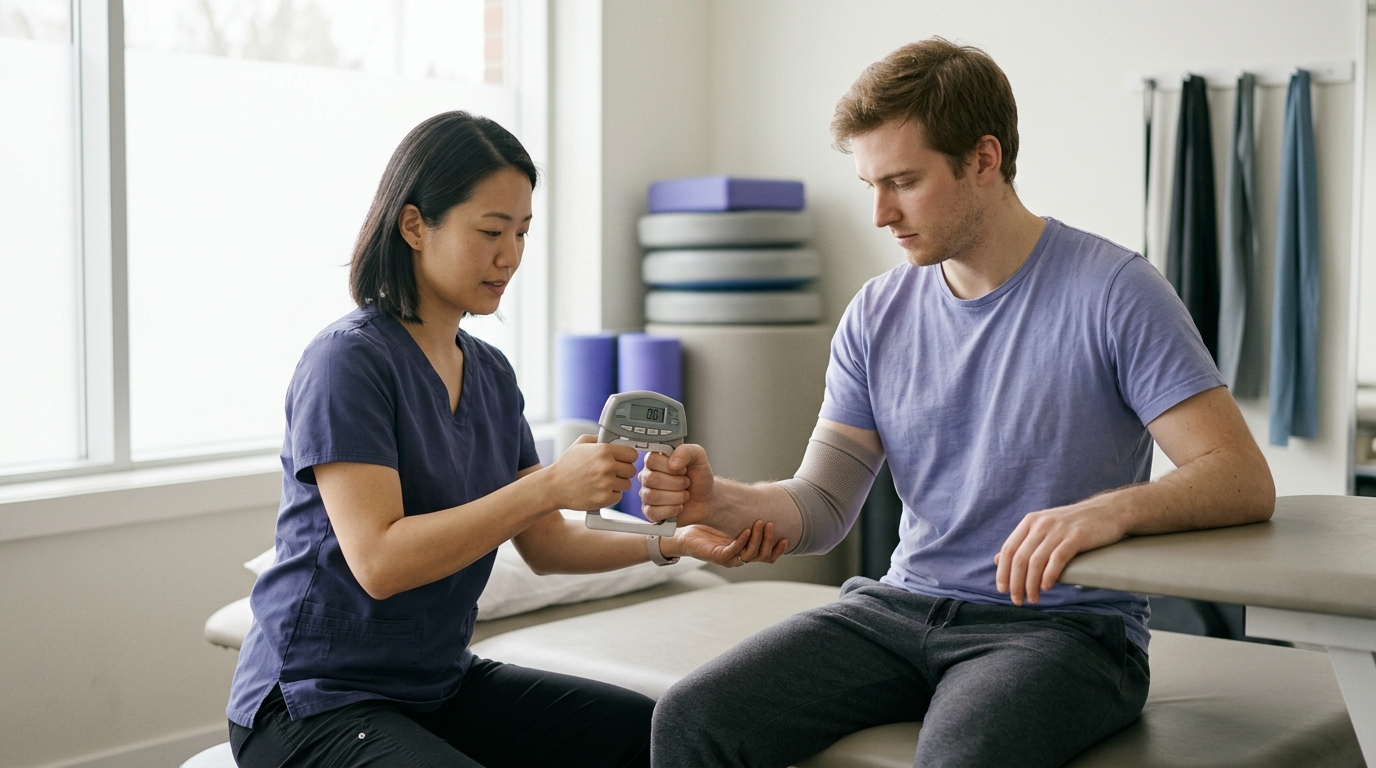

A 90 percent limb symmetry index serves as a key recovery benchmark, helping clinicians accurately assess peak force, functional capacity, and safe return to sport.





Achieving equal strength between your limbs sounds like the ultimate proof of recovery. Many people assume that once an injured leg or arm matches the uninjured side on a strength test, the rehabilitation process is complete.
Research shows this assumption can be misleading. A person can achieve near-perfect symmetry between sides simply because the uninjured limb became weaker during weeks of rest. Symmetrical limbs can also still lack the absolute power, speed, and endurance needed for demanding activities.
Side-to-side comparisons provide useful information about your physical state under specific testing conditions. They do not act as a complete measure of recovery or a stand-alone clearance to resume full activity.
Understanding how to measure and interpret strength differences helps you make informed choices. Tracking raw output on both sides gives a much clearer picture of your progress than relying on a single percentage.
Interlimb asymmetry is a comparison between your right and left sides on a specific physical test. It tells you how one side performs relative to the other during that exact movement. It does not provide a universal grade on your overall physical function.
A difference in maximum pushing force is not the same as a difference in jumping height, running speed, or endurance. Physical performance involves several distinct qualities that recover on different schedules.
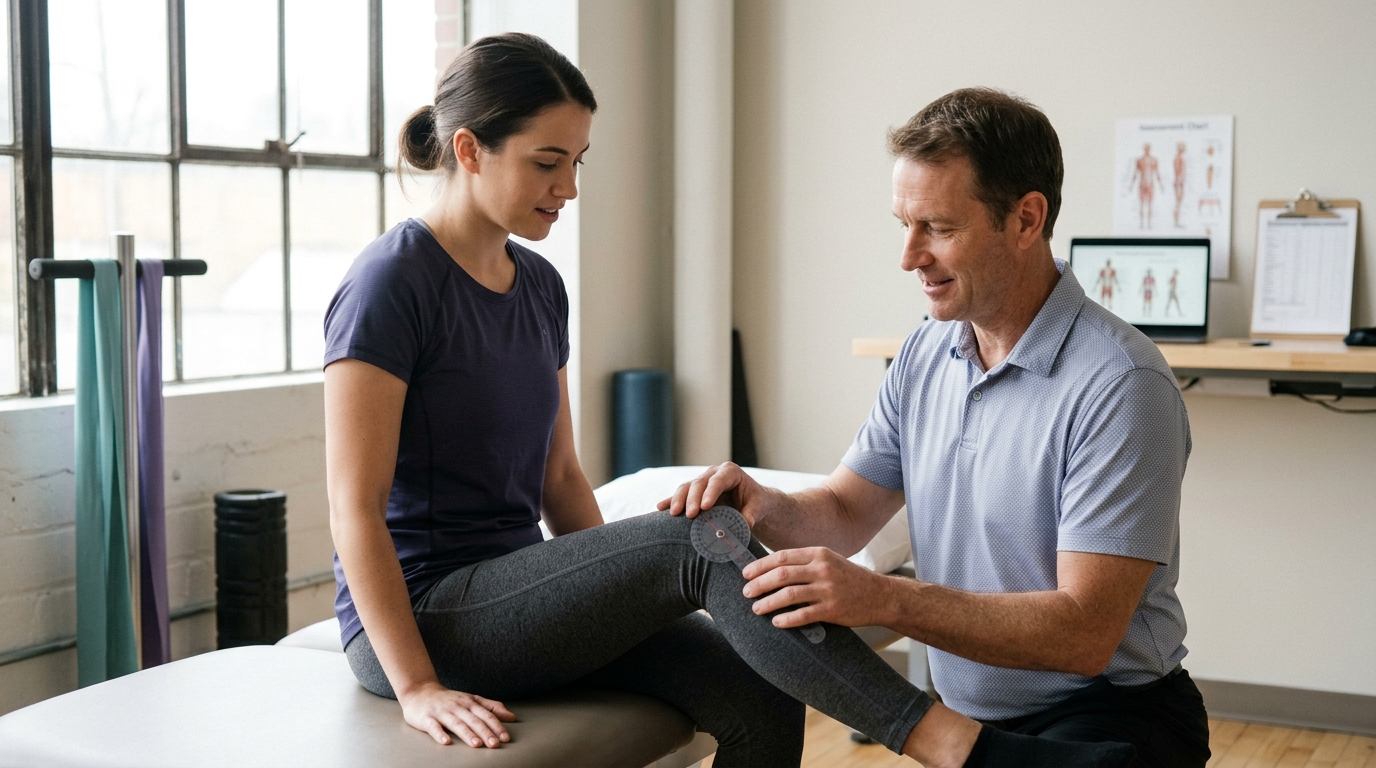
Absolute strength refers to the total amount of force or torque a limb can generate during a maximal effort. For example, a physical therapist might measure how hard your thigh muscles can push against a fixed sensor during an isometric knee extension.
Torque measures rotational force around a joint. When comparing sides, clinicians look at peak torque to see if the recovering joint can produce force when working at its limit.
Rate of force development measures how quickly a muscle can generate force from a resting state. Peak strength and explosive force production do not always recover at the same time.
You might be able to push with high force during a slow, five-second test. However, you might struggle to produce force in the first 100 milliseconds of a sudden movement. Quick physical reactions, such as catching your balance after a slip, depend heavily on this rapid force production.
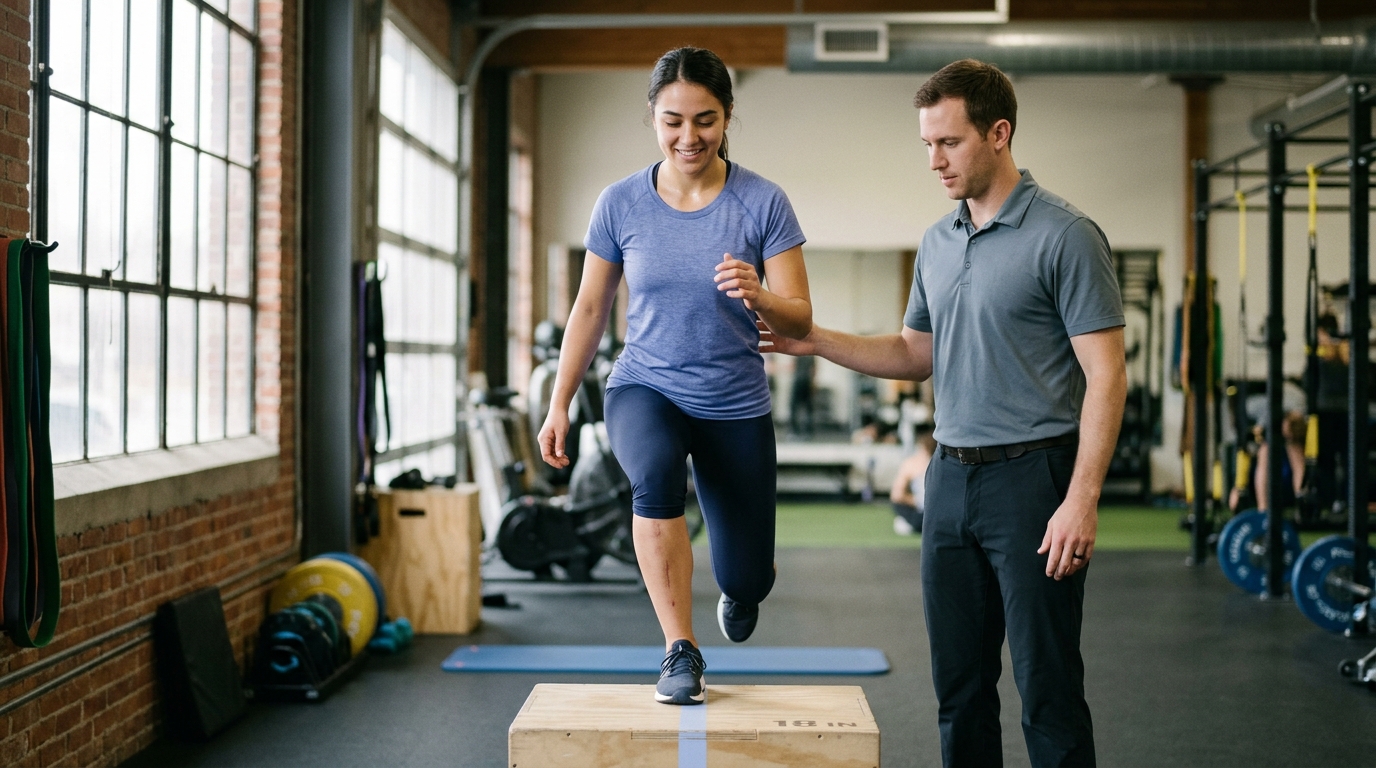
Functional tests look at total performance across a whole movement, such as hopping for distance or jumping onto a box. While these tests reflect real-world movements, the total score can hide underlying compensations.
A person can achieve equal hop distances on both legs by altering their movement strategy. They might rely more on their hip and ankle to make up for weakness in the knee. Tracking functional tasks alongside isolated strength measurements helps you catch these subtle compensations.
The Limb Symmetry Index, often abbreviated as LSI, is the standard formula used in physical therapy and sports medicine. It is typically calculated by dividing the score of the injured limb by the score of the uninjured limb, then multiplying by 100.
For instance, if your injured leg produces 180 Newton-meters of torque and your uninjured leg produces 200 Newton-meters, your LSI is 90 percent. While this math is straightforward, the percentage is only as useful as the baseline numbers behind it.
Medical research has closely examined strength symmetry, particularly in people recovering from knee injuries and shoulder surgeries. The evidence provides helpful clarity on what symmetry numbers can predict and where their limits lie.
In orthopedic rehabilitation, reaching an LSI of 90 percent or higher is a common milestone. Clinical protocols often use this 90 percent mark across a battery of strength and hop tests to gauge readiness.
Recent studies show that meeting a 90 percent symmetry threshold does not eliminate the risk of future problems. A critical analysis published in 2024 examined athletes after ACL reconstruction. The researchers found that strength and hop symmetry values could not reliably separate athletes who remained healthy from those who sustained a second injury within two years.
Symmetry scores describe a relationship between two limbs at a single point in time. They do not reflect how tissues respond to cumulative fatigue, unexpected collisions, or sport-specific demands.
The strongest body of evidence regarding symmetry highlights the shifting baseline of the comparison limb. When you reduce your overall activity after an injury or surgery, your uninjured limb also loses strength, power, and muscle mass.
If your uninjured leg loses 15 percent of its strength during recovery, the injured leg will appear closer to it in percentage terms. A person may reach a 90 percent LSI not because the injured side fully recovered, but because the healthy side deteriorated.
Research tracking recovery over 18 months has documented cases where athletes achieved low asymmetry scores while remaining well below their preinjury capacity. Serial testing and comparing numbers against preinjury baselines help prevent this false sense of security. You can read more about how physical capabilities rebuild over time in our guide to strength and performance rebuilding.
Research also demonstrates that equal output does not mean equal biomechanics. In studies of male athletes performing vertical jumps, individuals frequently met strength symmetry benchmarks while continuing to show altered joint mechanics.
During landing, individuals often offload the recovering joint by shifting work to the lower back or the opposite limb. A standard scale or measuring tape registers a successful jump, but motion sensors reveal that the limbs are behaving differently.
Interpreting physical testing data requires a clear understanding of testing limitations. Avoiding common assumptions ensures that you use your recovery data constructively.
The uninjured side is the most convenient comparison available, but it is not a static control subject. It experiences detraining, changes in daily use, and altered mechanics as it compensates for the injured side.
Relying entirely on the other limb can cause you to stop rehabilitation too early. When possible, physical therapists look at normative data for your age, body weight, and activity level to see if both sides meet healthy standards.
Every physical measurement tool has a degree of natural variation known as measurement error. Handheld dynamometers, computerized strength chairs, and jump mats all have specific limits to their precision.
A difference of three to five percent between sessions might simply reflect normal device variation or small changes in body position. Systematic reviews on handheld dynamometry emphasize looking for changes that exceed the minimal detectable change percentage, which can be up to 15 percent depending on the muscle group tested.
Symmetry requirements vary significantly depending on the joint and the muscle group in question. What applies to the quadriceps does not automatically apply to the hamstrings, calf muscles, or shoulder rotators.
In overhead athletes, for instance, the dominant shoulder often has different internal and external rotation strength ratios compared to the non-dominant side. Bern consensus guidelines for shoulder injuries state that there is no single test battery that works for every person. Strength goals must match the functional role of that specific joint.
Most strength testing occurs when a person is well-rested at the start of a clinical appointment. However, real-world activities and recreation require strength under sustained physical fatigue.
Research tracking repeated jump tests shows that side-to-side differences often widen as fatigue sets in. In some instances, asymmetry numbers appear to improve under fatigue only because the uninjured limb experiences a sharp drop in performance. Evaluating how you move and produce force when tired provides critical insights for safe progression.
Accurate tracking requires selecting the right tools and keeping testing conditions consistent across sessions. Objective data provides a helpful roadmap when used alongside clinical guidance.
Handheld dynamometers are portable devices that a clinician presses against your limb, or that you push against while secured with straps. They measure isometric force output in pounds, kilograms, or Newtons.
These tools offer an accessible way to gather objective numbers outside of specialized biomechanics labs. Using fixed straps to secure the device improves reliability by removing tester strength from the equation.
Isokinetic machines are computerized dynamometers that control the speed of movement while measuring the resistance you provide throughout the entire range of motion. They are widely regarded as a precise standard for measuring joint torque.
These devices evaluate both concentric actions, where the muscle shortens, and eccentric actions, where the muscle lengthens under tension. While effective, they are primarily found in specialized research centers and physical therapy clinics.
In fitness settings, strength is often measured using repetition maximum testing, such as finding a 5-rep or 10-rep maximum on a leg press machine. Single-leg strength testing on gym equipment provides practical feedback for general conditioning.
When performing single-leg resistance tests, form must remain strictly consistent between sides. Subtle shifts in foot placement, torso angle, or range of motion can make a weaker limb appear stronger than it is.
Functional batteries often combine multiple single-leg movements, such as:
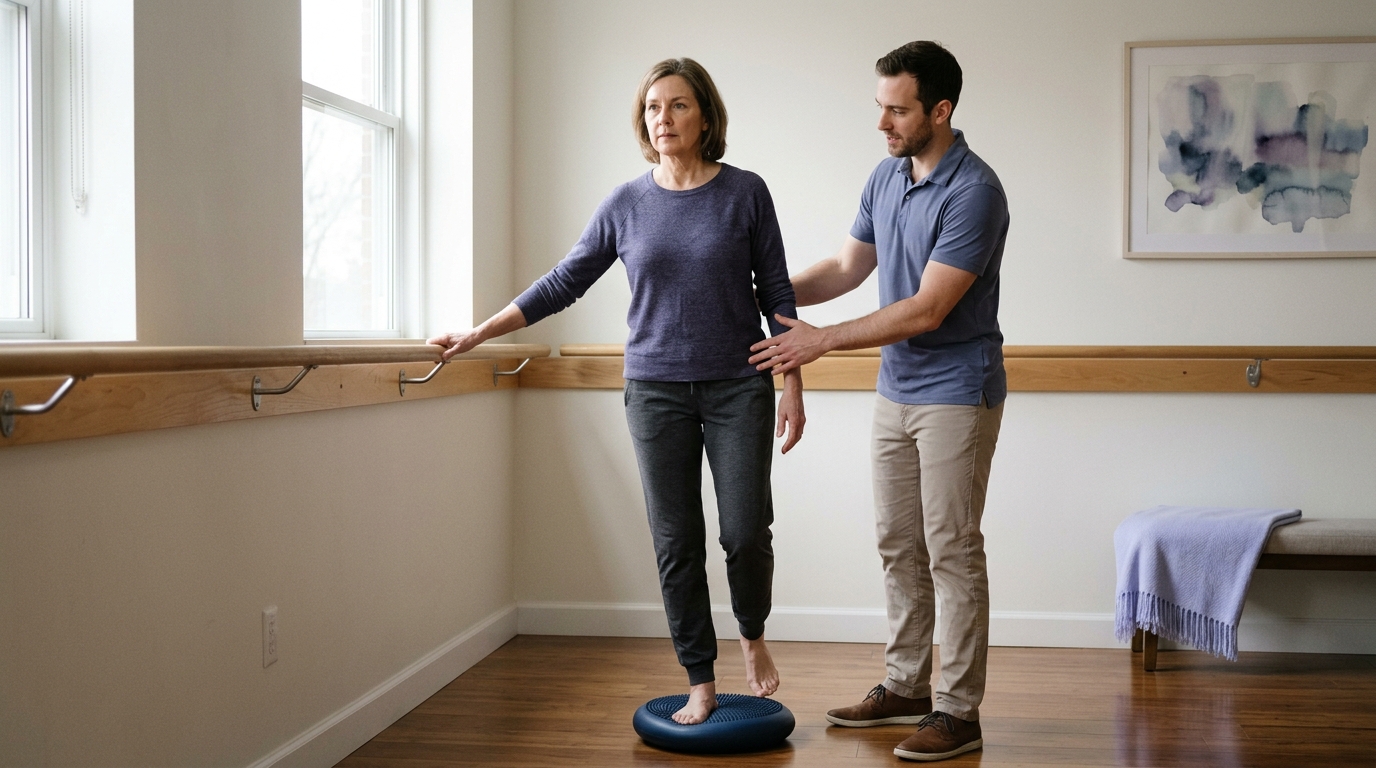
These tests reflect the limb's ability to absorb and produce force rapidly in horizontal directions. Adding vertical jump tests and drop jumps helps capture vertical force absorption, which often recovers on a slower timeline.
Recovery trajectories are rarely identical between individuals. Recognizing common test patterns helps you interpret your numbers with realistic expectations.
This pattern occurs when an individual rests excessively after an injury. The injured side makes modest gains, but the healthy side loses significant muscle mass and neuromuscular drive.
The resulting math produces a high symmetry score, such as 92 percent LSI. However, both limbs are weaker than the baseline required for safe recreation. The solution is to check raw strength numbers alongside the percentage calculation.
In this scenario, a person passes isolated dynamometer tests with flying colors, achieving equal force production in both legs. However, when asked to land from a step or perform a lateral cut, the recovering limb displays awkward mechanics.
The person may land stiffly, avoid bending the knee, or tilt their pelvis to minimize joint loading. This highlights why strength testing must be paired with functional movement assessments. You can review movement assessment principles in our mobility and movement resources.
Some individuals regain the ability to push hard against a heavy, stationary object, but their explosive power remains muted. During a jump test, their takeoff is noticeably slower on the recovering side.
This difference often reflects lingering neuromuscular inhibition. The nervous system hesitates to send rapid electrical signals to the previously injured muscle tissue. Targeted training focusing on rapid force production helps address this specific deficit.
A single maximal effort test might show an acceptable 8 percent difference between limbs. Yet, after five minutes of continuous movement, the difference widens to 25 percent.
Muscular endurance and metabolic recovery between efforts are distinct physical capabilities. If you plan to return to sports involving repeated sprints, interval work, or long hikes, tracking fatigue resistance is essential.
Not all healthy human bodies are perfectly symmetrical. Athletes who participate in sports like tennis, baseball, or golf naturally develop asymmetries in specific muscle groups due to repetitive unilateral demands.
Expecting a dominant throwing arm to match a non-dominant arm in external rotation strength is often unrealistic. In these cases, comparing current values to pre-injury baseline profiles or established athletic norms is more helpful than aiming for identical 50-50 symmetry.
The timeline for restoring balanced strength depends on several biological, biomechanical, and lifestyle variables. Understanding these factors prevents unnecessary frustration during rehabilitation.
Surgical procedures often induce temporary arthrogenic muscle inhibition, an involuntary neural response that prevents the surrounding muscles from firing fully. This natural protective mechanism protects healing tissues, but it slows the return of quad or rotator cuff strength.
Procedures that involve tendon grafts, joint resurfacing, or bone realignment require specific healing phases before heavy resistance training can begin. Reviewing our surgery and rehab articles can provide more context on these stages.
As we age, rebuilding muscle mass and tendon stiffness naturally takes more time and structured effort. Adults over 40 experience a gradual decrease in type II muscle fibers, which are responsible for explosive force.
Older adults can absolutely regain balanced strength after an injury. However, the process requires consistent progressive overload, adequate dietary protein, and patient pacing across several months.
The Bern Consensus on Return to Sport outlines three distinct phases of recovery rather than treating return as a single event:
Strength symmetry benchmarks often shift across this continuum. A person might meet criteria to enter modified participation with an 80 to 85 percent LSI, but full return to high-demand sports typically warrants higher absolute strength and movement symmetry. To explore the broader science of physical healing, visit our recovery science section.
Rebuilding balanced strength requires a deliberate training strategy. Focusing exclusively on standard two-leg exercises often allows the stronger side to dominate the movement.
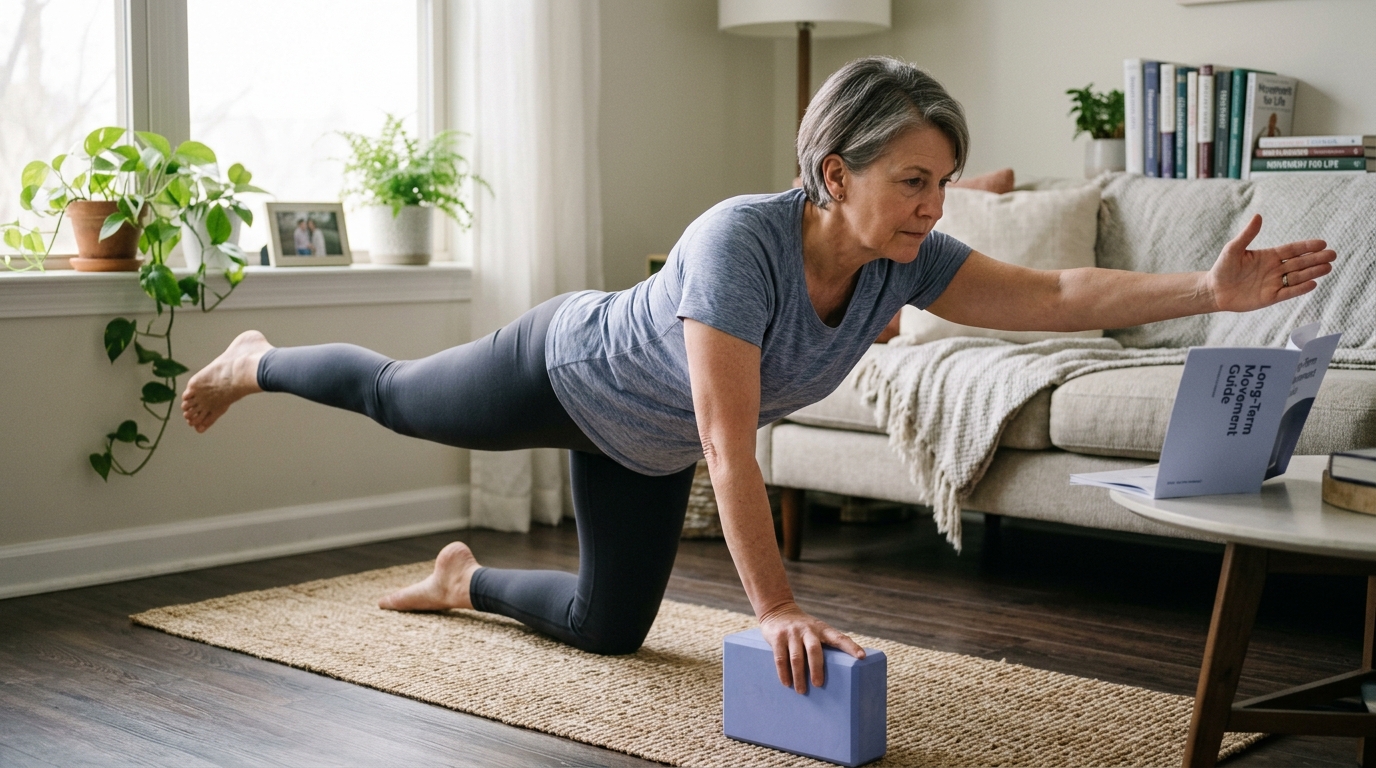
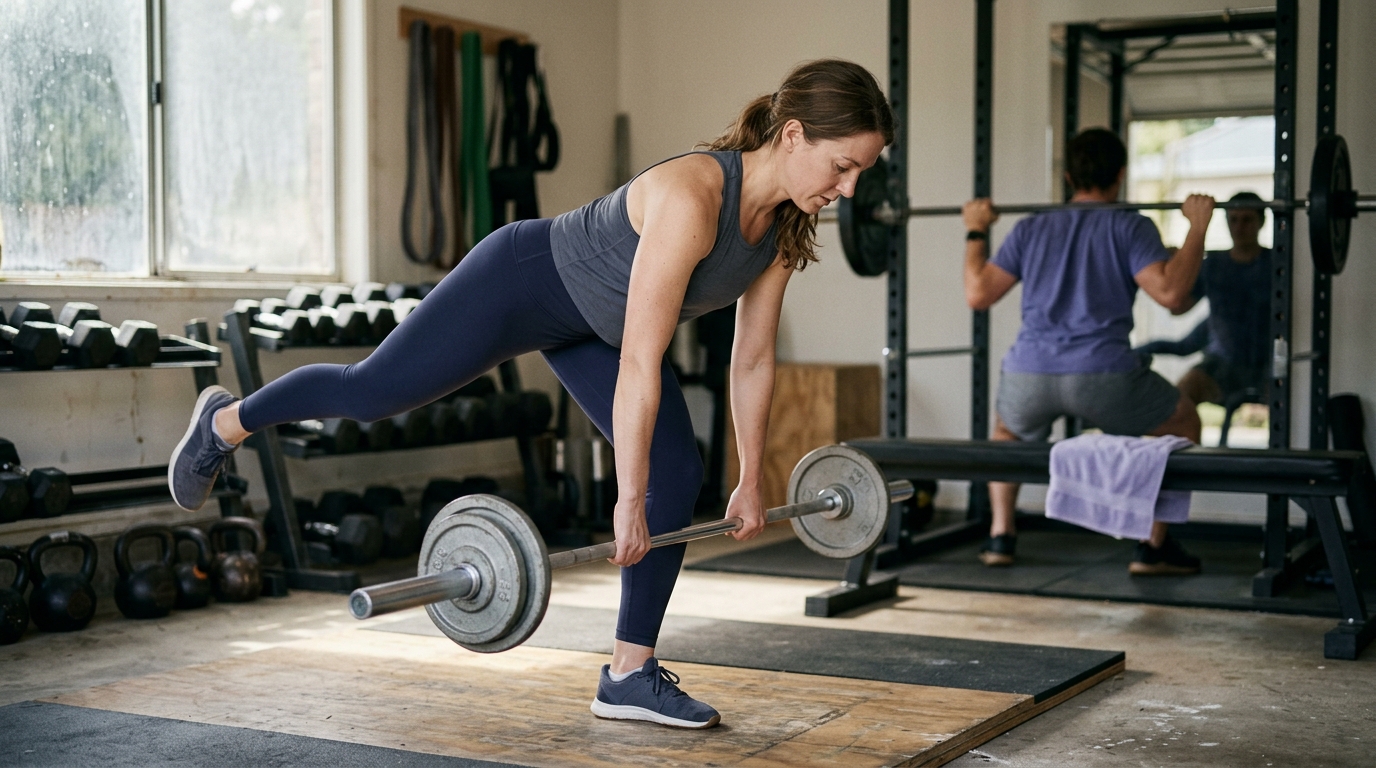
Unilateral training involves working one limb at a time. Exercises such as split squats, single-leg leg presses, single-arm rows, and step-ups force each side to bear its own load.
When performing unilateral work, start the exercise set with your recovering limb. Match the number of repetitions and resistance with the uninjured limb to prevent widening existing differences.
Historically, clinicians advised resting the healthy limb to avoid creating wider imbalances. Modern exercise science shows the opposite is true: continuing to train the healthy limb supports overall recovery.
A physiological phenomenon known as cross-education occurs when training one side of the body provides neural benefits to the resting opposite side. Keeping the uninjured side strong helps maintain baseline nervous system drive and minimizes detraining.
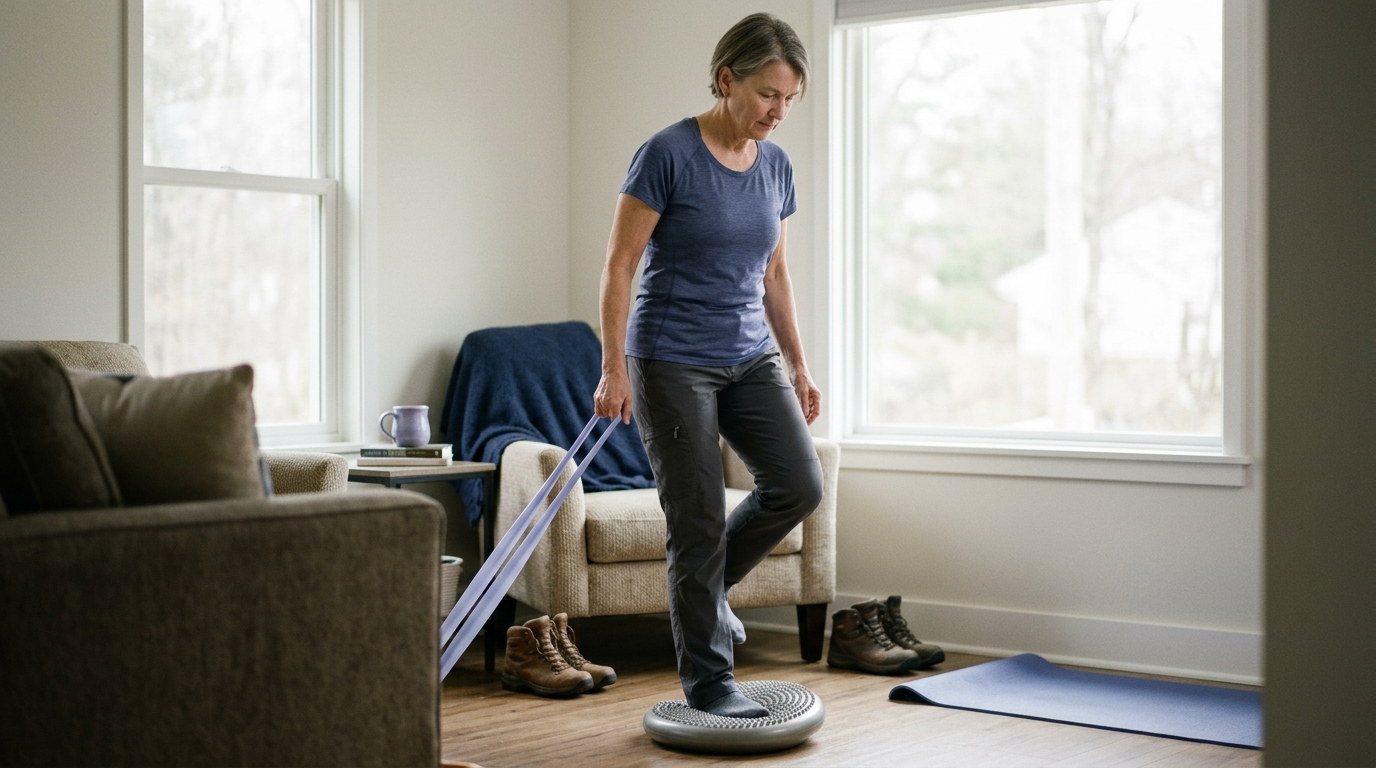
Rebuilding physical function follows a logical progression of movement complexity:
Progression should always be guided by joint symptoms, swelling, and movement quality rather than arbitrary calendar dates. For deeper strategies on athletic progression, explore our strength and return to sport resources.
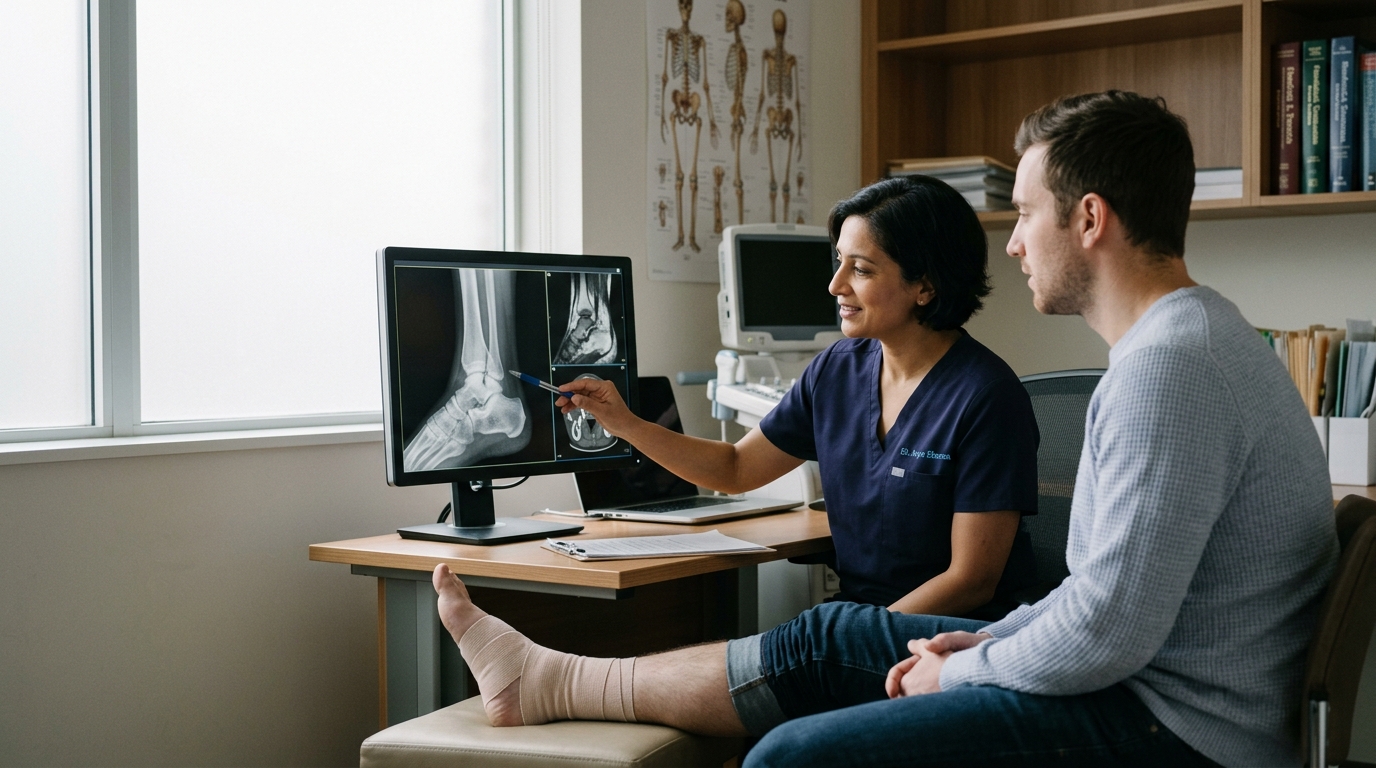
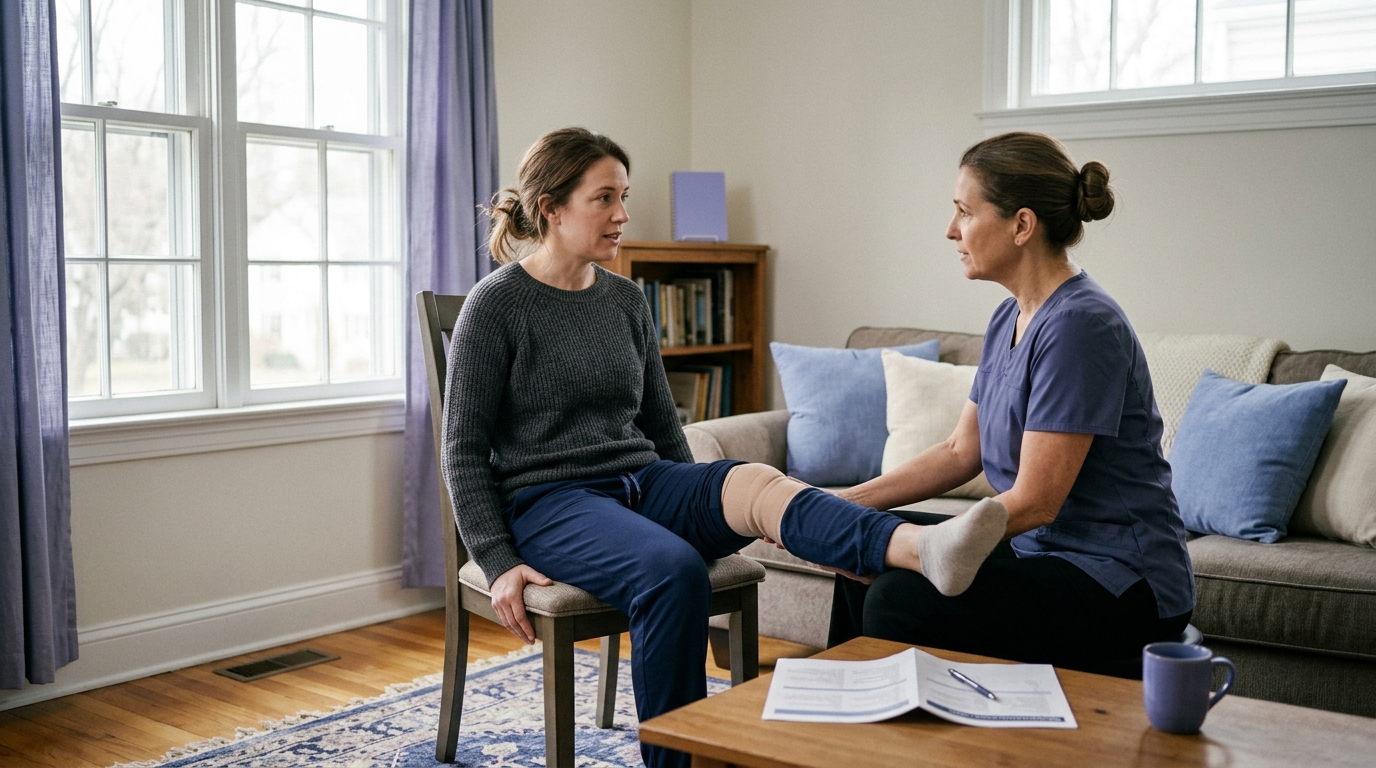
Navigating strength recovery is most effective when done in partnership with your physical therapist or orthopedic physician. Asking specific questions helps clarify your path forward.
Rebuilding physical capacity after an injury is a gradual process that involves more than matching numbers on a chart. Strength symmetry provides valuable information about how your limbs compare under specific testing conditions, but it cannot guarantee complete safety or full functional recovery on its own.
A comprehensive view of recovery accounts for absolute strength, explosive force, movement mechanics, fatigue resistance, and psychological confidence. By tracking both sides over time and progressing through structured phases, you build a resilient foundation for long-term activity.
Tracking your physical capabilities with patience and objective data ensures you return to your favorite activities with genuine, balanced strength.

Use ReboundBody resources to understand common recovery stages, rehab terms, movement limits and strength rebuilding. Each guide is designed to make a complex comeback easier to understand.


Read practical guidance on injury recovery, rehabilitation, mobility and rebuilding strength as you work your way back to activity.
Explore Resources